More than n! join orders?

Earlier today I was getting paranoid and thought I had found an error in my “Intro to SQL tuning” paper namely that there were more than n! join orders.

Here is what I said in the paper:

There are many possible join orders.  If the variable n represents the number of tables in your from clause there are n! possible join orders.  So, our example query has 3! = 6 join orders:

sales, products, customers
sales, customers, products
products, customers, sales
products, sales, customers
customers, products, sales
customers, sales, products

I knew that my main point was correct – there are a bunch of possible join orders.  But I wasn’t sure that n! was right.  Take the case of the join order sales, products, customers.  First you join sales and products with sales on the left and products on the right.  But when you join the result with customers does customers have to be on the right side of the resulting join?  Finally, late today I did a test script to show customers on either side of the join but with the same leading hint defining the join order.

/*+ leading(sales products customers) 
cardinality(customers 1)
cardinality(sales 1000000) 
cardinality(products 1000000) */

-------------------------------------------------
| Id  | Operation           | Name      | Rows  |
-------------------------------------------------
|   0 | SELECT STATEMENT    |           |   250G|
|*  1 |  HASH JOIN          |           |   250G|
|*  2 |   TABLE ACCESS FULL | CUSTOMERS |     1 |
|*  3 |   HASH JOIN         |           |   500G|
|*  4 |    TABLE ACCESS FULL| SALES     |  1000K|
|*  5 |    TABLE ACCESS FULL| PRODUCTS  |  1000K|
-------------------------------------------------

/*+ leading(sales products customers) 
cardinality(customers 1000000) 
cardinality(sales 1) 
cardinality(products 1) */

-------------------------------------------------
| Id  | Operation           | Name      | Rows  |
-------------------------------------------------
|   0 | SELECT STATEMENT    |           |   500K|
|*  1 |  HASH JOIN          |           |   500K|
|*  2 |   HASH JOIN         |           |     1 |
|*  3 |    TABLE ACCESS FULL| SALES     |     1 |
|*  4 |    TABLE ACCESS FULL| PRODUCTS  |     1 |
|*  5 |   TABLE ACCESS FULL | CUSTOMERS |  1000K|
-------------------------------------------------

I used cardinality hints to get customers to go before or after the join of sales and product.  So, I guess the right answer for now is that there are n! ways to list n tables in the from clause in the leading hint.  But there are more than n! execution plans that could result.

– Bobby

Posted in Uncategorized | Leave a comment

Faster commit time with shared servers

This is a follow up to my previous post “Faster commit time with fewer sessions“.  I’ve put together a test case against an HP-UX server running 10.2.0.3 of Oracle that shows commits six times faster with shared servers than with dedicated servers.

In this test I have an 8 core server.  I increased the large pool to 500 megabytes and set the shared servers to 16 and dispatchers to 32.  This enabled shared servers.  Then I ran 160,000 inserts and commits from 128 simultaneous sqlplus sessions once with dedicated servers and once with shared.  Shared servers ran in about 1/6th of the time as dedicated.

In my first presentation, “Focusing Your Oracle Database Tuning Efforts For PeopleSoft Applications” which is available on my resources page I introduce my script for a session profile.  I used this profile script based on V$ tables to compare the waits and CPU used with dedicated and shared servers.

Dedicated:

TIMESOURCE                        SECONDS PERCENTAGE
------------------------------ ---------- ----------
TOTAL_TIME                            617        100
UNACCOUNTED_TIME                      487         79
log file sync                          51          8
CPU                                    36          6
SQL*Net message from client            22          4
events in waitclass Other              16          3
latch: cache buffers chains             4          1

Shared:

TIMESOURCE                        SECONDS PERCENTAGE
------------------------------ ---------- ----------
TOTAL_TIME                            106        100
UNACCOUNTED_TIME                       98         92
log file sync                           5          5
CPU                                     3          3

So, total time of 617 seconds for dedicated versus 106 for shared.  Interestingly in my previous post I was testing against 11.2.0.3 on 32 bit windows and didn’t have the unaccounted time.  Unaccounted time is usually wait for the CPU or for paging.  I’m pretty sure this is really the time the log file sync sits in the CPU queue.

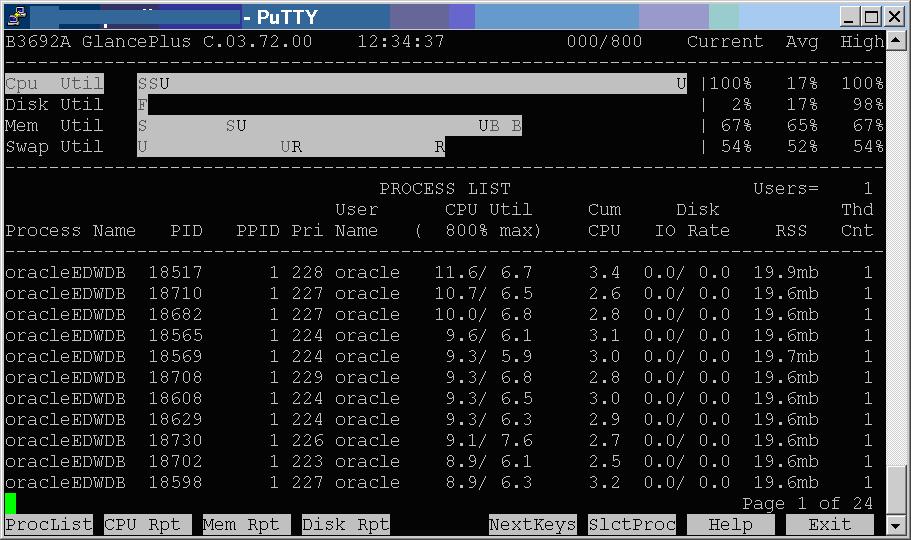
Here is CPU with dedicated servers:

CPU use dedicated servers

CPU use dedicated servers

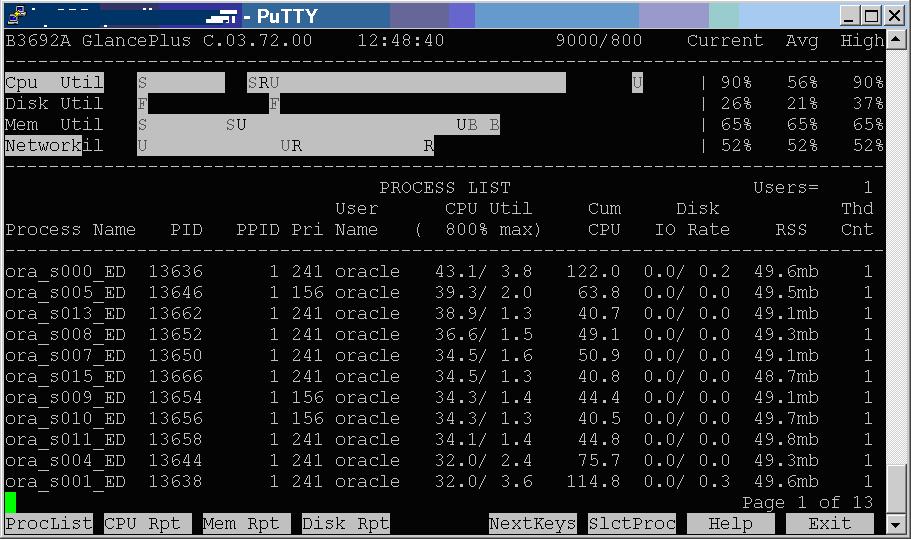
Here is the CPU use with shared servers:

CPU use shared servers

CPU use shared servers

The CPU wasn’t pegged at 100% in the shared servers case so LGWR was free to process commits at the rate the I/O system was capable of supporting.

Here are the top events from the AWR report in both cases.

Dedicated:

Top 5 Timed Events


Event Waits Time(s) Avg Wait(ms) % Total Call Time Wait Class
log file sync 153,329 5,857 38 8.2 Commit
CPU time 5,043 7.1
latch free 33,256 1,023 31 1.4 Other
latch: cache buffers chains 26,058 563 22 .8 Concurrency
latch: enqueue hash chains 19,766 550 28 .8 Other

Shared:

Top 5 Timed Events


Event Waits Time(s) Avg Wait(ms) % Total Call Time Wait Class
CPU time 1,049 79.9
log file sync 169,941 625 4 47.6 Commit
log file parallel write 31,951 43 1 3.3 System I/O
latch: shared pool 23,044 15 1 1.2 Concurrency
latch free 14,431 9 1 .7 Other

Notice how the log file sync = commit time is almost ten times as long with dedicated servers.

I had to change these parameters to setup shared servers:

  large_pool_size          = 500M
  sga_max_size             = 2544M
  sga_target               = 2544M
  dispatchers              = "(PROTOCOL=TCP)(DISPATCHERS=32)"
  shared_servers           = 16
  max_shared_servers       = 16

I created a 500 meg large pool and added 500 meg to the sga_max_size and sga_target parameters.  I set dispatchers at 32 but I don’t think this was that significant.  The key was shared_servers and max_shared_servers at 16.  This kept the commits from overloading the 8 cores.

Here are the tnsnames.ora entries:

DEDICATED =
  (DESCRIPTION =
    (ADDRESS_LIST =
      (ADDRESS = (PROTOCOL = TCP)(Host = xxxxxx)(Port = 1522))
    )
    (CONNECT_DATA = (SERVER = DEDICATED) (SID = xxxxxxx))
  )

SHARED =
  (DESCRIPTION =
    (ADDRESS_LIST =
      (ADDRESS = (PROTOCOL = TCP)(Host = xxxxxx)(Port = 1522))
    )
    (CONNECT_DATA = (SERVER = SHARED) (SID = xxxx))
  )

Interestingly, if I didn’t specify (SERVER = DEDICATED) the connection defaulted to shared.  So, potentially we could just set the six parameters on our production database, bounce it,  and the web servers would start using shared servers and run much faster.  Time will tell, but this test was pretty convincing and easy to setup.

– Bobby

Posted in Uncategorized | Leave a comment

Faster commit time with fewer sessions

I’m trying to understand how to prevent the database server that supports one of our web sites from becoming overwhelmed when the CPU %used gets too high.  Once CPU gets above about 80% performance takes a nose dive and CPU quickly flat lines at 100% and queuing begins making the system unusable.  I mentioned in an earlier post that Tom Kyte, a noted Oracle performance expert, had recommended that our web server run with fewer database sessions.  Right now we have hundreds of connections to the database from the web servers.  Based on Tom’s recommendation the best number of connections from the web servers to the database would be about twice the number of CPU’s.

I believe that one reason we need to move to fewer sessions is to speed up commit time.  When the CPU gets busy the log writer process (LGWR) gets starved for CPU and sessions doing commits back up waiting for their log file sync’s to complete.  So, I put together a test using my laptop which compares doing a bunch of inserts and commits spread across two different numbers of sessions.  In the first case I used twice the number of CPU’s which corresponds to Tom Kyte’s recommendation.  In the second case I used 16 times the number of CPU’s which represents our current configuration with many more sessions than CPU’s on our real web application.  My laptop has 2 CPU’s so the first example used 4 sessions and the second test used 32.

The result was that I was able to do 4 sessions with 80,000 inserts and commits each in 143 seconds, but it took me 627 seconds to do 32 sessions with 10,000 inserts and commits each.  The main factor in the increase was the increased log file sync time.  We know that our web servers do a lot of inserts and commits and that log file sync waits go crazy during our outages so this simple test seems to be a  valid comparison.

Here is a profile of the time spent by one of our four sessions:

TIMESOURCE                        SECONDS PERCENTAGE
------------------------------ ---------- ----------
TOTAL_TIME                            143        100
log file sync                          72         50
SQL*Net message from client            44         31
CPU                                    21         15
UNACCOUNTED_TIME                        4          3

Here is the profile of one of the 32 sessions:

TIMESOURCE                        SECONDS PERCENTAGE
------------------------------ ---------- ----------
TOTAL_TIME                            613        100
log file sync                         420         69
SQL*Net message from client           167         27
UNACCOUNTED_TIME                       22          4
CPU                                     3          0

In both cases the row count at the end is 320,000.  The AWR reports make it clearer what is going on.  The log file sync time in the second case is mostly CPU and much longer than in the first.  Here are the top five events with four sessions:


Event Waits Time(s) Avg wait (ms) % DB time Wait Class
log file sync 320,008 289 1 73.13 Commit
DB CPU 109 27.56
SQL*Net message to client 640,097 2 0 0.43 Network
log file switch completion 12 1 70 0.21 Configuration
Disk file operations I/O 25 0 17 0.11 User I/O

Here they are with 32 sessions:

Event Waits Time(s) Avg wait (ms) % DB time Wait Class
log file sync 320,094 13,535 42 93.66 Commit
DB CPU 123 0.85
Disk file operations I/O 134 10 75 0.07 User I/O
enq: TX – contention 252 10 38 0.07 Other
enq: FB – contention 113 5 42 0.03 Other

Note how the log file sync has gone up to 42 milliseconds instead of 1 millisecond.  Oracle document “Troubleshooting: log file sync’ Waits [ID 1376916.1]” explains that the background wait “log file parallel write” shows how long the I/O is taking for each log file sync.  In the second case log file parallel write was 11 milliseconds so the difference between the log file sync and log file parallel write 42-11=31 ms is mostly CPU queue time.

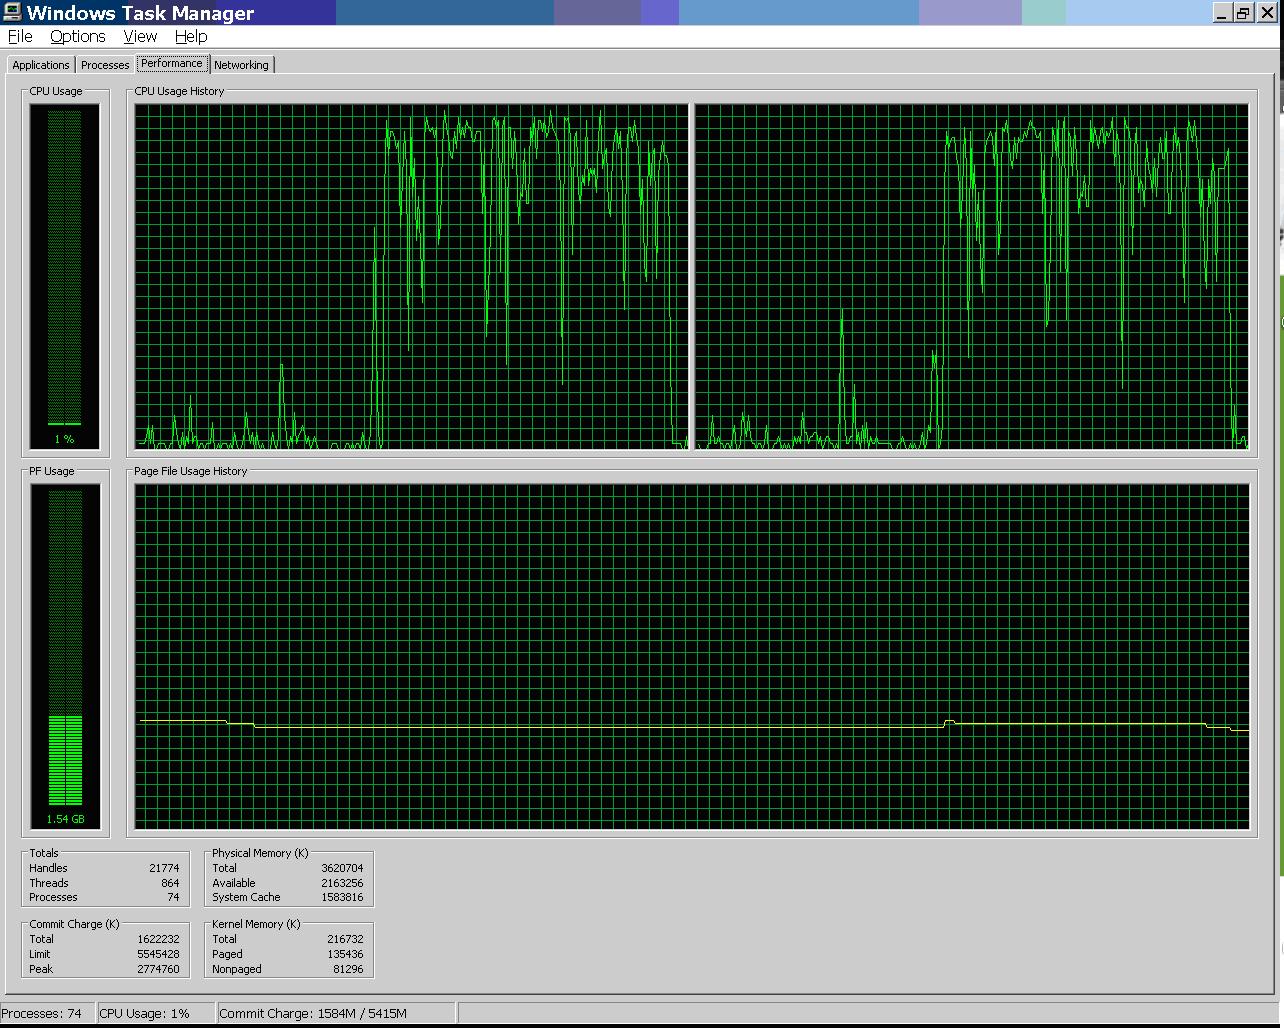
Here is how my CPU looked with four sessions:

CPU use in four session example

CPU use in four session example

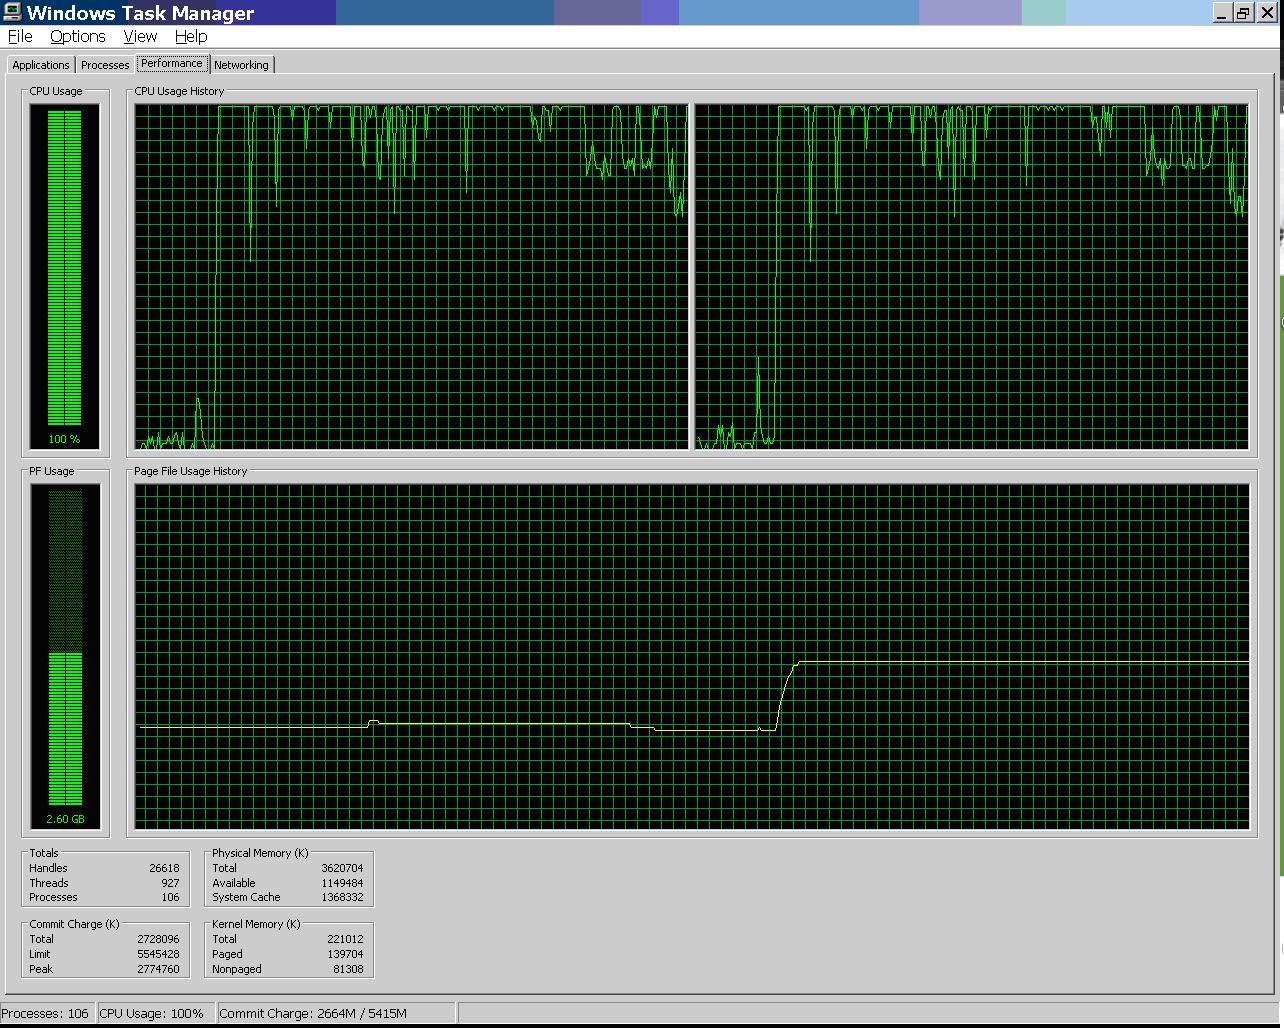
Here is how my CPU looked with 32 sessions:

CPU use with 32 sessions

CPU use with 32 sessions

Here is a zip with all my test files and their output: zip

So, this experiment is evidence to support the idea that if you have a bunch of inserts and commits the total time taken will be less if the number of sessions used is about twice the number of CPU’s as opposed to much more than twice the number of CPUs.

– Bobby

Posted in Uncategorized | 3 Comments

Added plan_hash_value to DBA_HIST_SQLSTAT query

I modified my query of DBA_HIST_SQLSTAT that I use for query tuning to include plan_hash_value.  This is nice because you can see whether a particular plan corresponds to a longer run time.  Here a link the the modified script(updated).

Here is edited output for a real issue I’m working on today:

PLAN_HASH_VALUE END_INTERVAL_TIME     Elapsed Average ms
--------------- --------------------- ------------------
      127033930 14-JUL-12 03.00.45 AM         3.72306098
     4129337110 17-JUL-12 03.00.25 AM         9.39056636
      127033930 18-JUL-12 03.00.09 AM         4.85851429
      127033930 21-JUL-12 03.00.23 AM         2.58389897
     4129337110 22-JUL-12 04.00.53 PM         305.116467
     4129337110 23-JUL-12 03.00.15 AM         42.6378382
     4129337110 24-JUL-12 03.01.00 AM         11.6052238
      127033930 25-JUL-12 03.00.16 AM         3.65477356
      127033930 26-JUL-12 03.00.31 AM         4.30130391
      127033930 27-JUL-12 03.00.15 AM         5.08272086
      127033930 28-JUL-12 03.00.26 AM         5.76550411
     4129337110 29-JUL-12 03.00.39 AM         106.969158
     2097624419 30-JUL-12 03.00.49 AM         1333.82567
     2097624419 31-JUL-12 03.00.10 AM          262.40561
     4129337110 01-AUG-12 03.00.24 AM         10.2028517
     2739482096 02-AUG-12 03.00.39 AM         1878.88872
     2739482096 02-AUG-12 04.00.52 AM         1897.64979
     2739482096 03-AUG-12 03.00.53 AM         2079.60304
      127033930 03-AUG-12 03.00.53 AM          18.854426
     2739482096 04-AUG-12 03.00.05 AM         453.994259
     4129337110 05-AUG-12 03.00.19 AM         46.4180495
     4129337110 05-AUG-12 05.00.19 PM         148.220406

127033930 and 4129337110 are the good plans.  2097624419 and 2739482096 are the bad plans.  The column with the heading “Elapsed Average ms” is the average run time in milliseconds for the given plan for that hour’s AWR snapshot.

– Bobby

Posted in Uncategorized | 1 Comment

optimizer_features_enable hint

I thought I had already posted on this, but I didn’t.  I recently used this hint to resolve an issue with a custom PeopleSoft Financials batch process running too long.  A particular query was taking over an hour instead of seconds.  Here is the hint:

/*+ optimizer_features_enable('10.1.0') */

The plan for the problem query included a HASH GROUP BY operation and there are known bugs in the 10.2 version of Oracle with hash group by taking a lot of temp space and running a long time.  The cool thing about the optimizer_features_enable hint is that it only affects the one SQL statement.  The hint I used told the optimizer only to use features available in 10.1.0 and then the query did a SORT GROUP BY.  With the hint the query runs in a second.

So, if you have a problem query that is getting an error or running too long because of a bug in a feature that is new in your release it might work better if you use optimizer_features_enable to disable the use of the latest features.

Note that only certain version numbers are valid and those are documented in the reference manual.  Here is the current 11.2 document: link to manual

– Bobby

Posted in Uncategorized | Leave a comment

Breaking up query to force join order

If all else fails and you can’t get the optimizer to join the tables together in an efficient order you can break the query into multiple queries saving the intermediate results in a global temporary table.  Here is how to break our three table join into two joins – first sales and products, and then the results of that join with customers:

SQL> create global temporary table sales_product_results
  2  (
  3  sale_date date,
  4  customer_number number,
  5  amount number,
  6  product_type varchar2(12),
  7  product_name varchar2(12)
  8  ) on commit preserve rows;

SQL> insert /*+append */
  2  into sales_product_results
  3  select
  4  sale_date,
  5  customer_number,
  6  amount,
  7  product_type,
  8  product_name
  9  from sales, products
 10  where
 11  sales.product_number=products.product_number and
 12  sale_date between
 13    to_date('01/01/2012','MM/DD/YYYY') and
 14    to_date('01/31/2012','MM/DD/YYYY') and
 15  product_type = 'Cheese';

SQL> commit;

SQL> select
  2  sale_date, product_name, customer_name, amount
  3  from sales_product_results spr, customers c
  4  where
  5  spr.customer_number=c.customer_number and
  6  c.customer_state = 'FL';

SALE_DATE PRODUCT_NAME CUSTOMER_NAME         AMOUNT
--------- ------------ ----------------- ----------
02-JAN-12 Chedder      Sunshine State Co        100
03-JAN-12 Chedder      Green Valley Inc         200
04-JAN-12 Feta         Sunshine State Co        300
05-JAN-12 Feta         Green Valley Inc         400

Breaking a query up like this is a very powerful method of tuning.  If you have the ability to modify an application in this way you have total control over how the query is run because you decide which joins are done and in what order.  I’ve seen dramatic run time improvement using this simple technique.

– Bobby

Posted in Uncategorized | 2 Comments

awrgrpt.sql AWR report for RAC and Exadata

Recently I discovered the RAC version of the AWR report – awrgrpt.sql.  Today was the first time I used it for a real system.  In this case a 12 node Exadata system.  awrgrpt.sql is in $ORACLE_HOME/rdbms/admin just like the normal AWR report – awrrpt.sql.

In this case we had a complaint about the system performance for a particular hour but the OS Statistics showed an almost idle system.  Here is the output: OS Statistics.

This was really helpful because in the past I had been running awrrpt.sql on all 12 nodes.  I made a script to do it, but still it ran for a long time and 12 AWR reports were hard to handle.

awrgrpt.sql produced a nice summary of the activity of all 12 nodes and in this particular case the OS Statistics part of the report clearly shows an almost idle system in terms of CPU.

– Bobby

Posted in Uncategorized | 7 Comments

CPU queuing and library cache: mutex X waits

I had a funny thing happen today.  I had recently participated in a forum thread about  library cache: mutex X waits.  In that discussion the library cache: mutex X waits were on an AWR report but when we dug deeper we realized it was because the database server’s CPU was totally pegged out and overloaded.

Today, I saw the same thing on one of my own servers.  Here are the top 5 events:

Event Waits Time(s) Avg wait (ms) % DB time Wait Class
DB CPU 53,149 8.67
db file sequential read 3,188,834 21,758 7 3.55 User I/O
library cache: mutex X 4,260 8,943 2099 1.46 Concurrency
log file sync 1,226,545 4,562 4 0.74 Commit
latch: cache buffers chains 21,097 4,281 203 0.70 Concurrency

Notice how small a percentage of the DB time these top events are.  This is because most of the time is spent waiting on the CPU queue.  Here was the load when I checked it:

$ uptime
11:35am  up 268 days, 13:27,  4 users,  load average: 14.40, 14.52, 14.76

This server has 2 cores so a load of 14 means a lot of queuing.

The operating system statistics on the AWR report show the same thing – a load of 15 and a lot of OS_CPU_WAIT_TIME.

Operating System Statistics

  • *TIME statistic values are diffed. All others display actual values. End Value is displayed if different
  • ordered by statistic type (CPU Use, Virtual Memory, Hardware Config), Name
Statistic Value End Value
AVG_BUSY_TIME 3,925,986
AVG_IDLE_TIME 1,115,182
AVG_IOWAIT_TIME 606,908
AVG_SYS_TIME 383,368
AVG_USER_TIME 3,541,505
BUSY_TIME 7,853,118
IDLE_TIME 2,231,218
IOWAIT_TIME 1,214,686
SYS_TIME 768,403
USER_TIME 7,084,715
LOAD 1 15
OS_CPU_WAIT_TIME 17,375,799,211,900
RSRC_MGR_CPU_WAIT_TIME 23,323
VM_IN_BYTES 442,109,952
VM_OUT_BYTES 540,237,824
PHYSICAL_MEMORY_BYTES 68,687,269,888
NUM_CPUS 2
NUM_CPU_CORES 2
NUM_CPU_SOCKETS 1
TCP_RECEIVE_SIZE_DEFAULT 32,768
TCP_RECEIVE_SIZE_MAX 1,073,725,440
TCP_RECEIVE_SIZE_MIN 24,576
TCP_SEND_SIZE_DEFAULT 32,768
TCP_SEND_SIZE_MAX 2,147,483,647

So, I thought I would post this so people could see what an AWR report looks like when the cpu it totally pegged out and queuing big time.  Note that the AWR report was from 1 am to 3 pm so the starting load was low but the ending load during the afternoon was at 15.

– Bobby

Posted in Uncategorized | Leave a comment

ECO Presentations

The list of the East Coast Oracle Users conference presentations came out: Click here for the list (NO LONGER EXISTS).

My “Introduction to SQL Tuning” talk is on there.  I also submitted an Exadata talk but it looks like Michael Ault – who is very good – will be presenting on the same topic.  If Michael has to pull out for some reason I may be doing my Exadata talk in place of his but there is no need for two of them and I’m sure his will be excellent.

Overall it is a very good list of presenters including Craig Shallahamer, Tom Kyte, Don Burleson and others.  Makes me a little nervous actually, but I’ll practice up and try to hold my own with my SQL tuning talk.

– Bobby

Posted in Uncategorized | Leave a comment

Comments

I’ve changed the blog’s settings regarding comments.  I was trying to prevent spam but it looks like the settings I chose prevented people from leaving comments.  One person emailed me to ask about this.  So, I’m still going to moderate all comments but you don’t need an account on this site or to enter your email address or name.  I think my settings were blocking the Jetpack functionality which allows you to comment using your Facebook user id  and others.  You should be able to enter your comment where it says “Leave a comment” or “Leave a reply” below each post.

– Bobby


Posted in Uncategorized | Leave a comment