Event 27401 level 16384 prevents scheduler window from changing resource manager plan

We have event 27401 level 16384 set on some of our systems and it appears that this is preventing the scheduler from changing the active resource manager plan when the window opens.

I haven’t been able to find any documentation on this event and level.  This blog post is all I could find on event 27401 but it doesn’t mention level 16384.  So, I did a test on a small test instance on my laptop and was able to show that one effect of activating this event and trace level is to prevent a scheduler window from changing the active resource manager plan.  I setup a test case where one session would create a table and get a row lock on that table.  Then I would open a new session and run a script that would attempt to update the locked row.  My theory is that the second session would appear as an active session.  Then I could set the plan to limit active sessions for a given resource manager consumer group to 1 and then any sessions would hang on a resource manager wait event.  I must have misunderstood what limiting active sessions to 1 would do because the session that should be hung on a lock wait ended up hung on a resource manager wait but that was fine.  My test of the scheduler window was just done by going into the Oracle Enterprise Manager database control on the Server tab and clicking on the Windows link in the Oracle Scheduler section and opening the window for the current day.  This should change the active resource manager plan from the one I hacked to limit active sessions to 1 to one that doesn’t limit active sessions.  I tried this without setting the event and trace level and the plan changed and the resource manager wait disappeared.  I set the event and bounced the instance and then opening the scheduler window didn’t change anything.  The plan stayed the same and the session was still hung on the resource manager wait.  I don’t recommend setting this event without Oracle support’s recommendation, but if you have it set maybe this post can give you a clue what it might be doing.  Here are some screenshots:

planwithoneactivesession

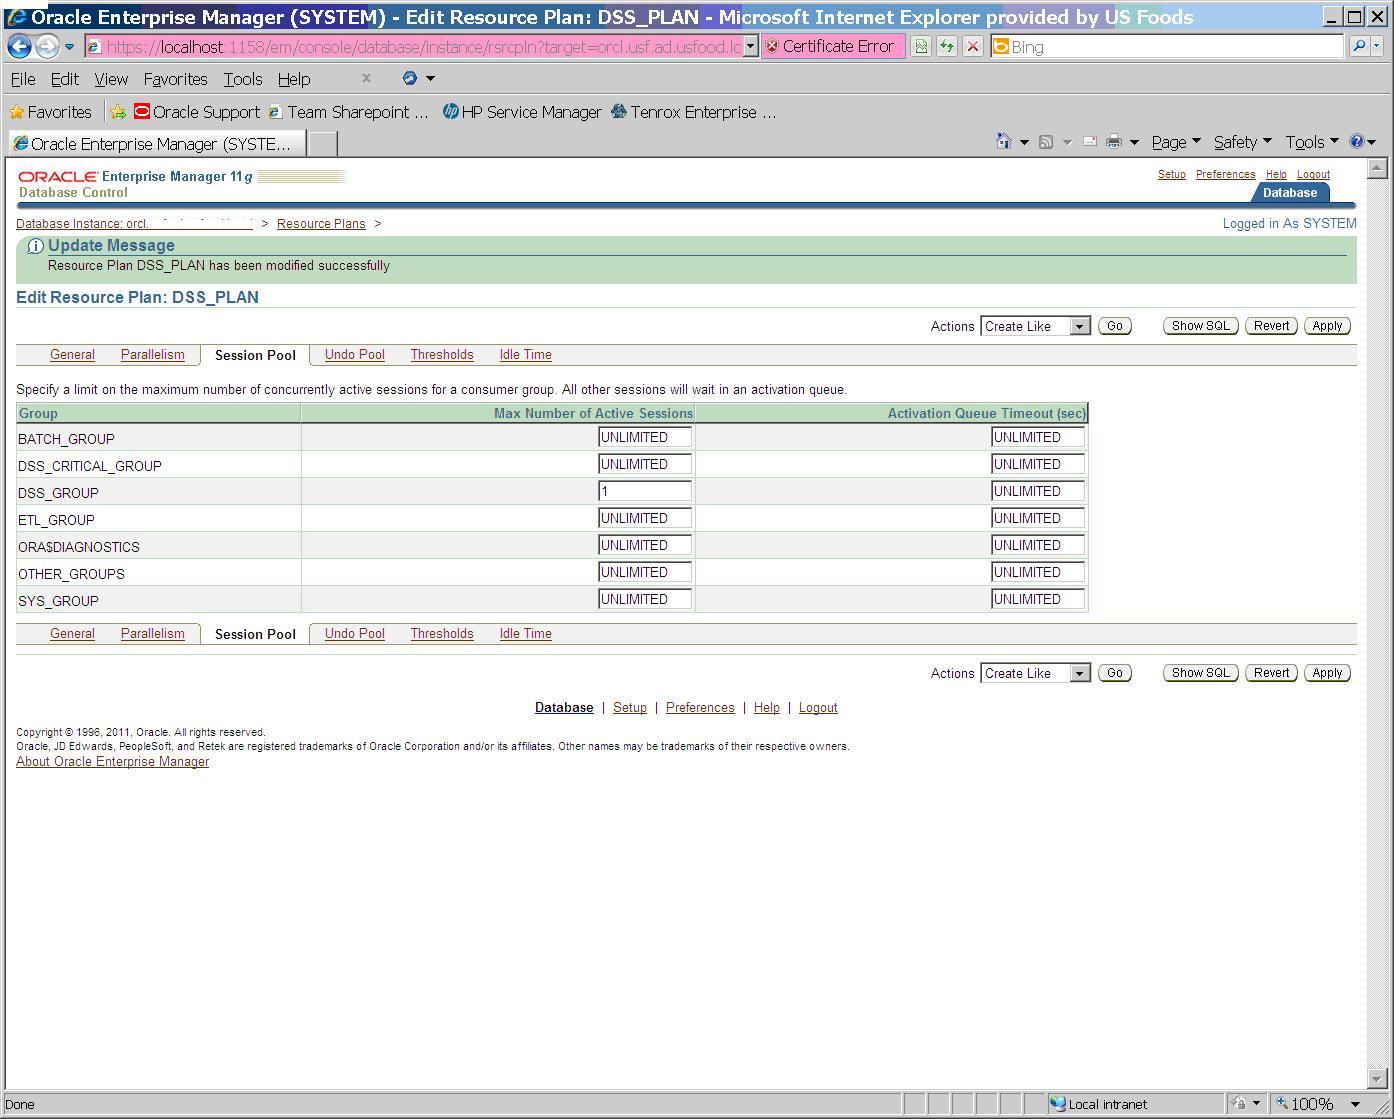
Change resource manager plan DSS_PLAN to limit DSS_GROUP consumer group to one active session.

assignplantotestuser

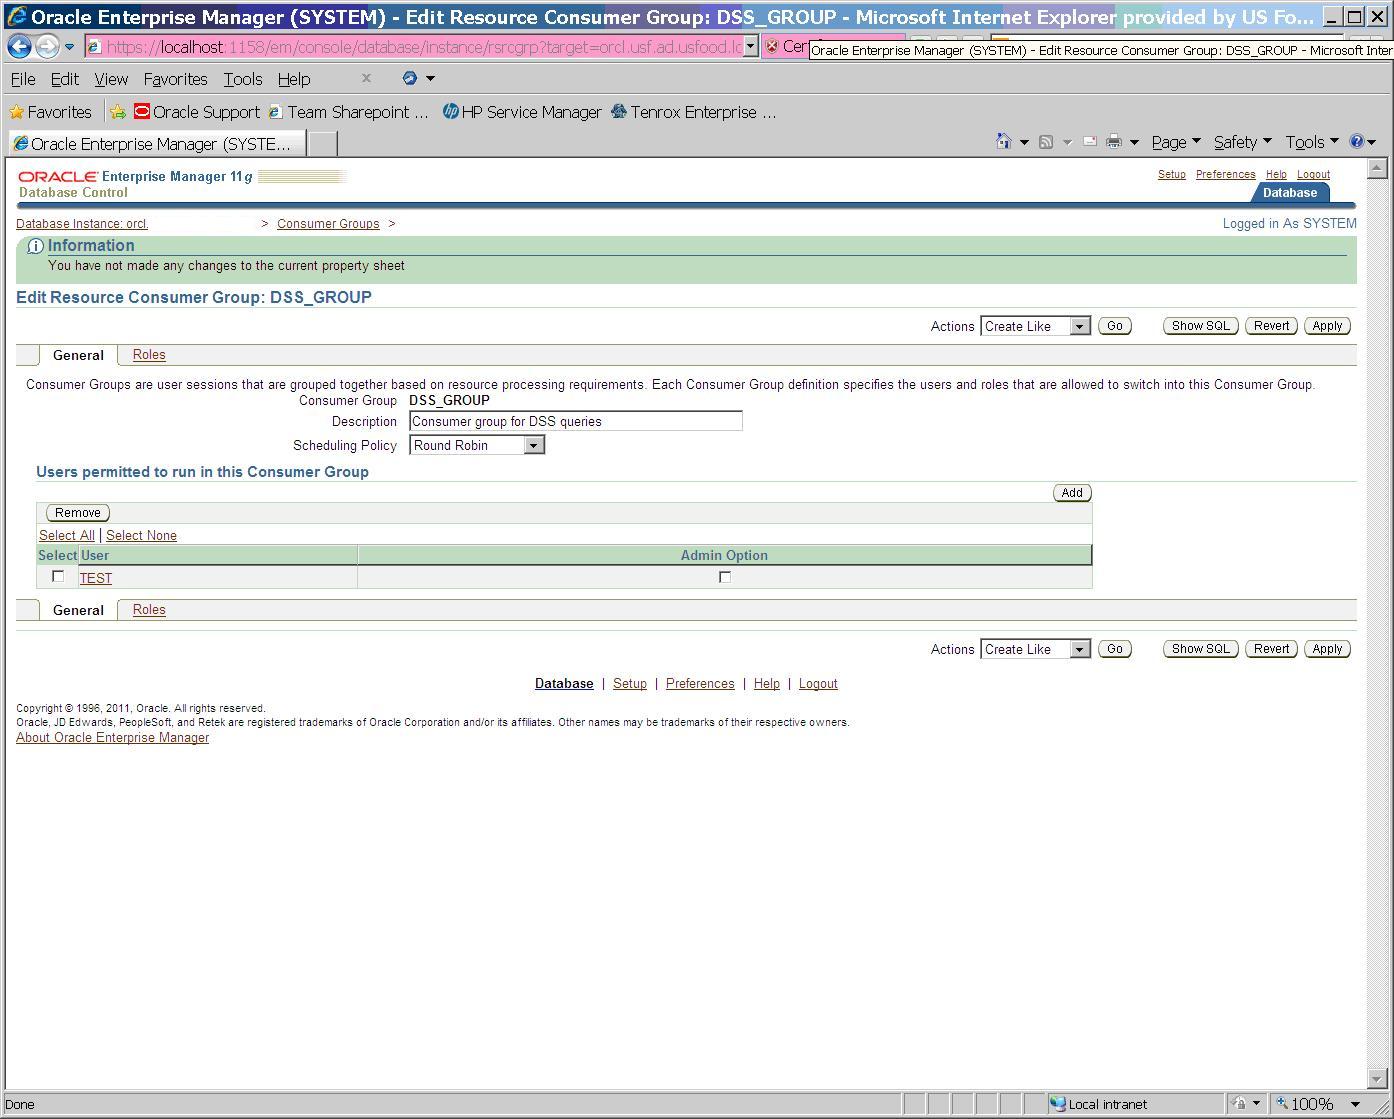
Assign user TEST to DSS_GROUP consumer group so it will be limited to one active session for our test.

putuserinconsumergroup

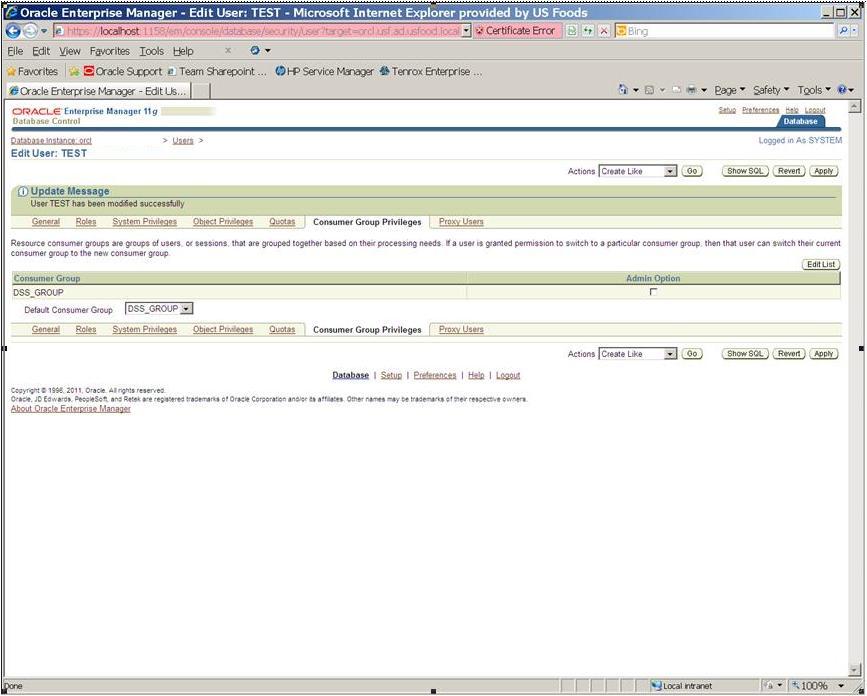
Make DSS_GROUP the default consumer group for the user TEST so it will be governed by this group when DSS_PLAN is active.

lockonerow

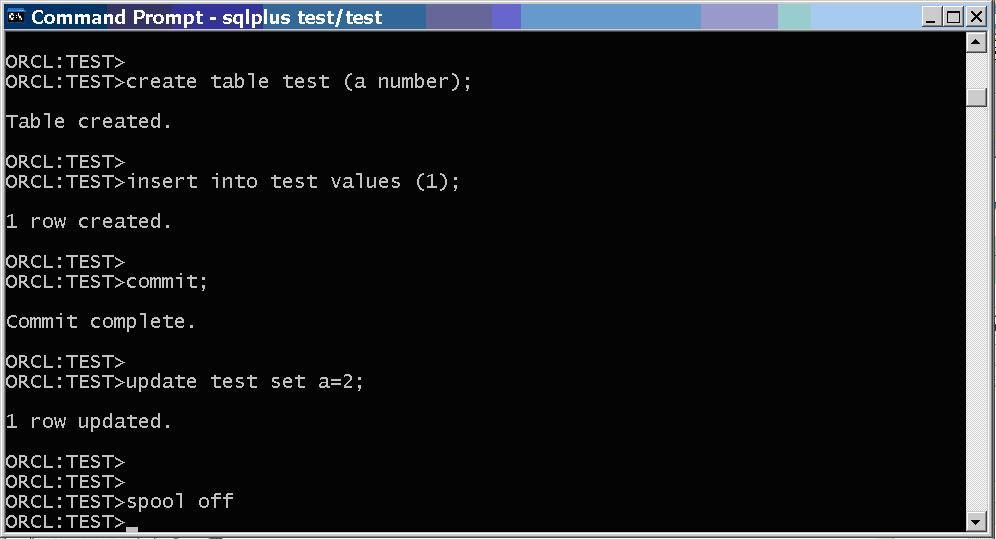
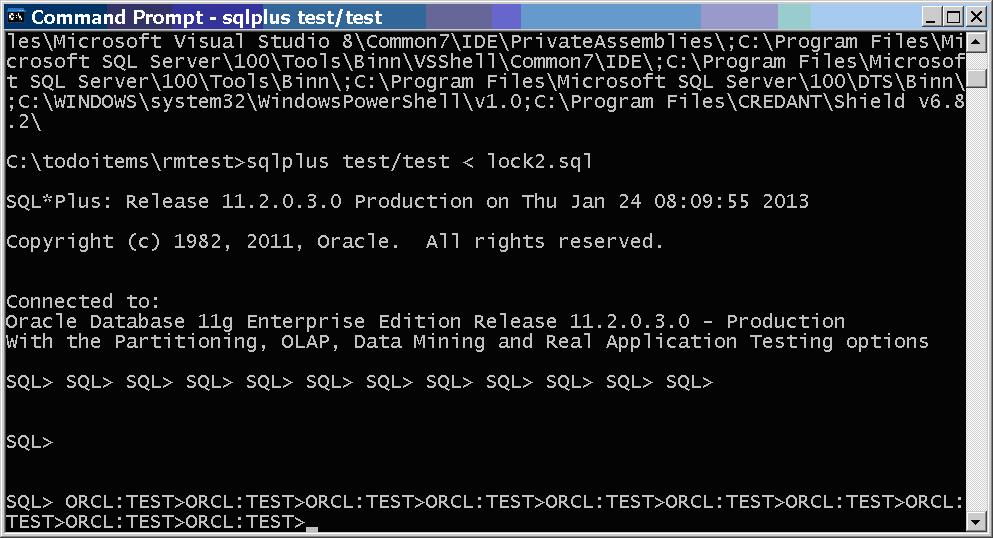
First session locks a row so second session will hang on it and be active.

hangsessionactivelimit

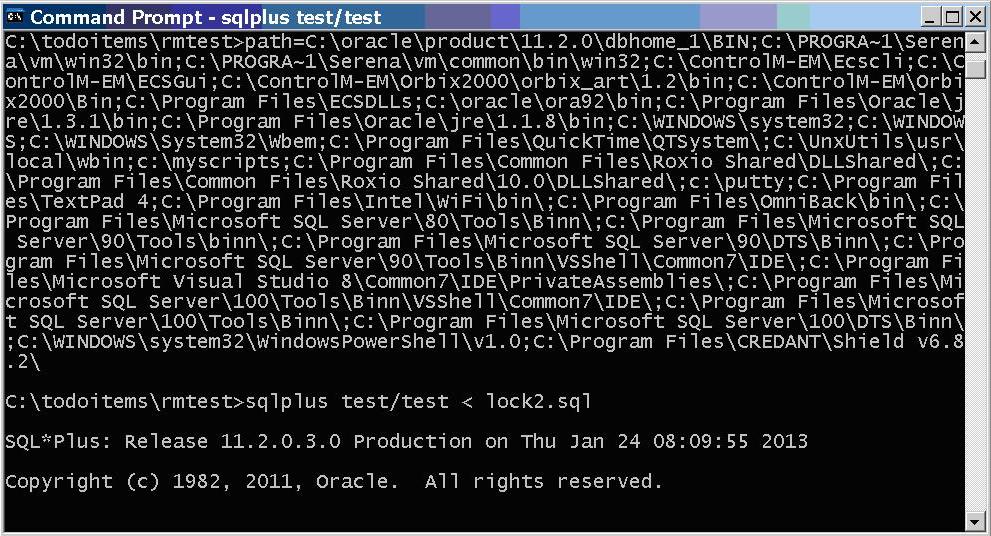
Second session doesn’t even get to the point of hanging on the lock.  Hangs on the active session limit.

resouremanagerwait

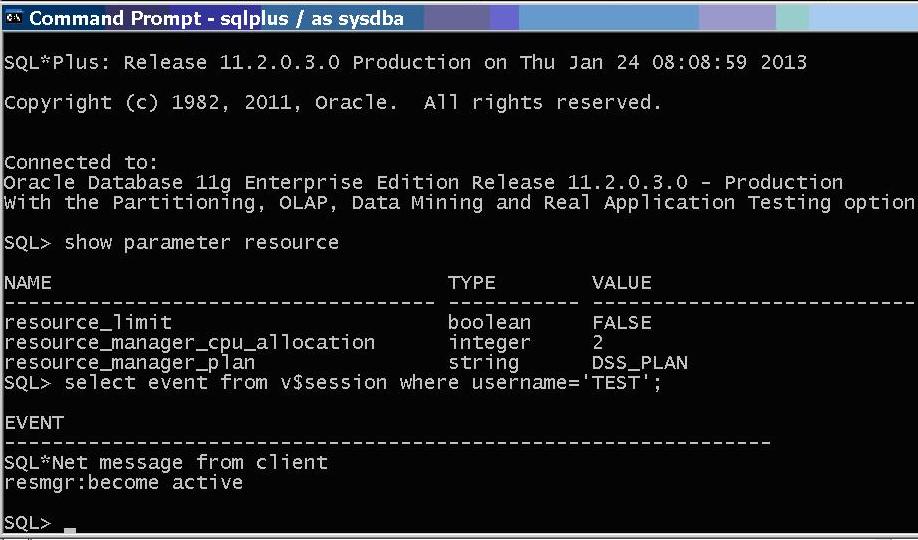
Wait is resource manager wait – not a row lock wait.

activeschedulerwindow

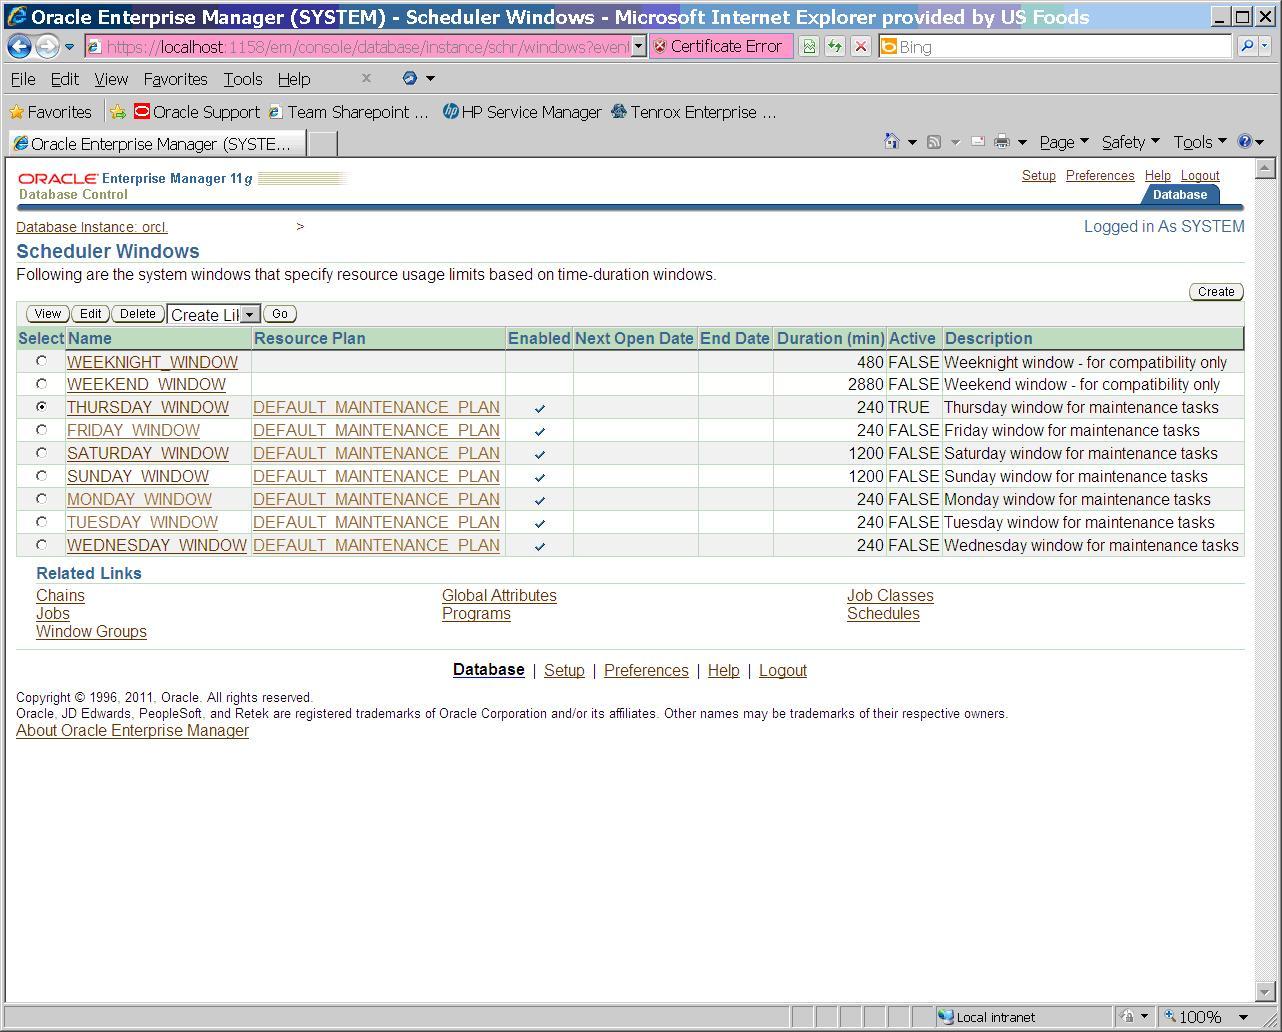
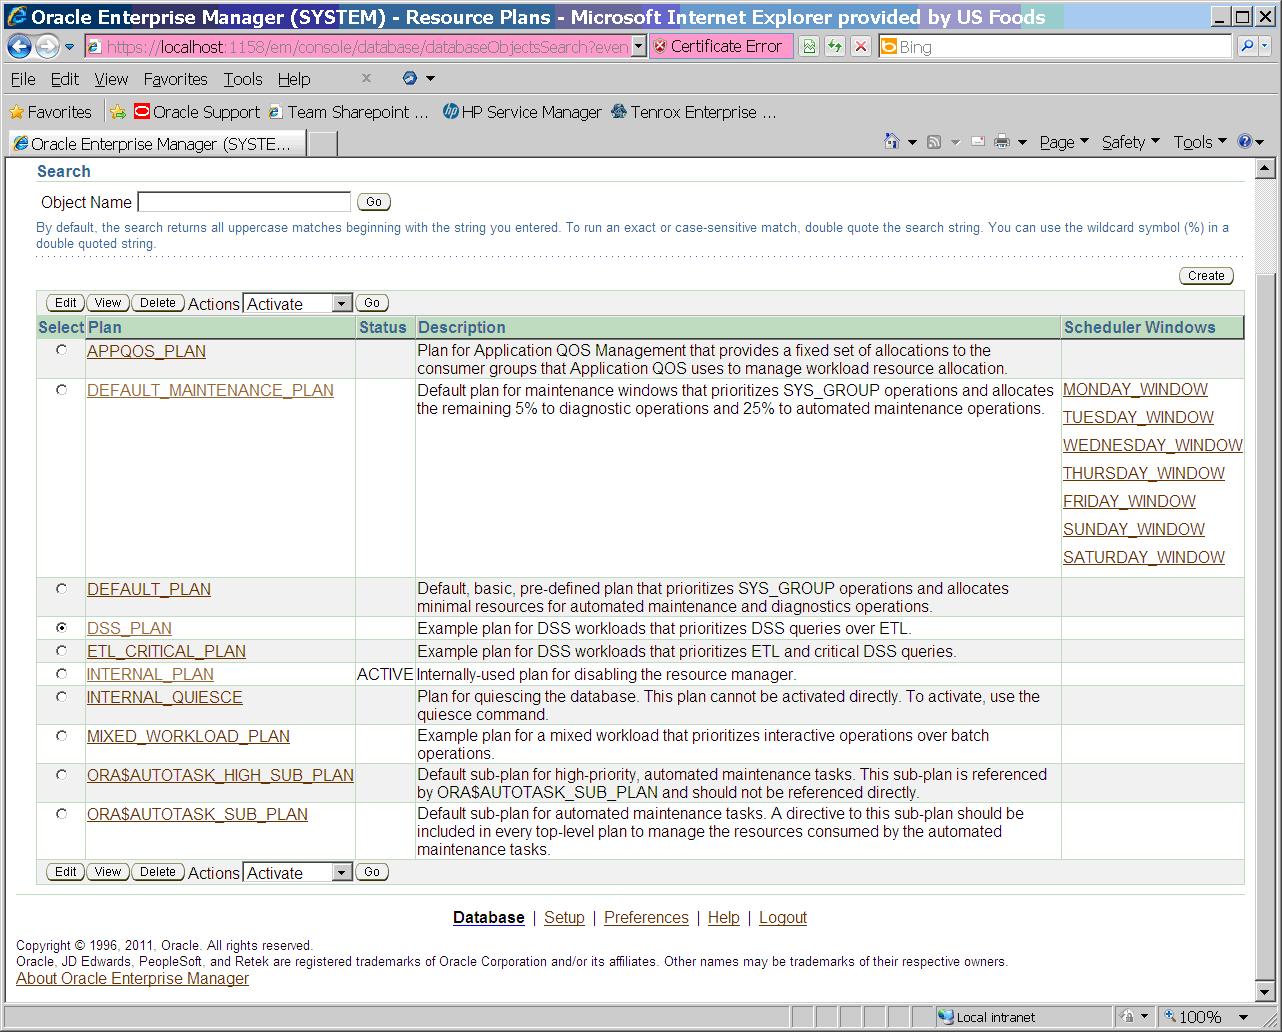
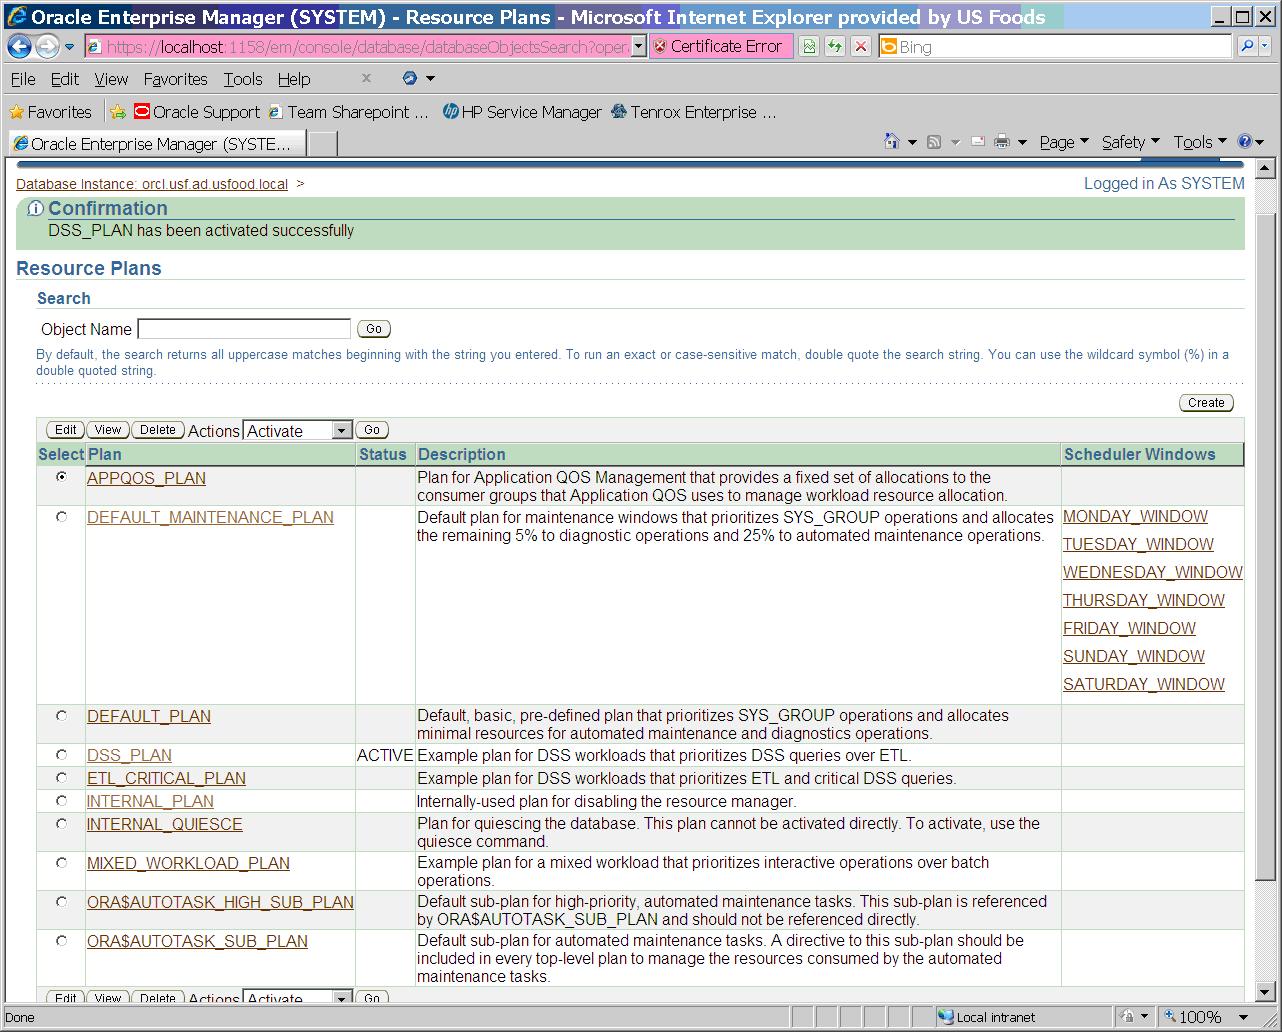
Activate today’s scheduler window.

scriptprocedestolock

After activating window the hung session proceeds to the update and hangs on a lock wait.
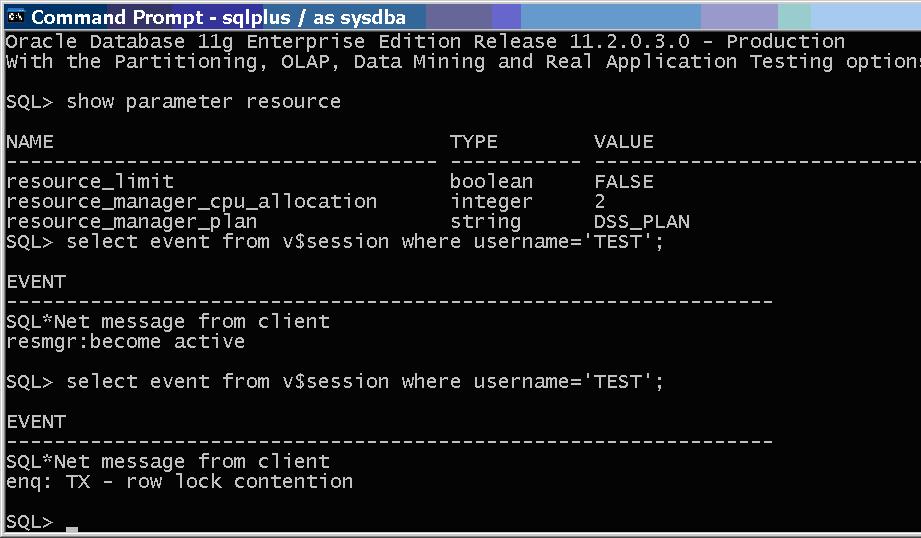
lockwait

Lock wait.

set27401level16384

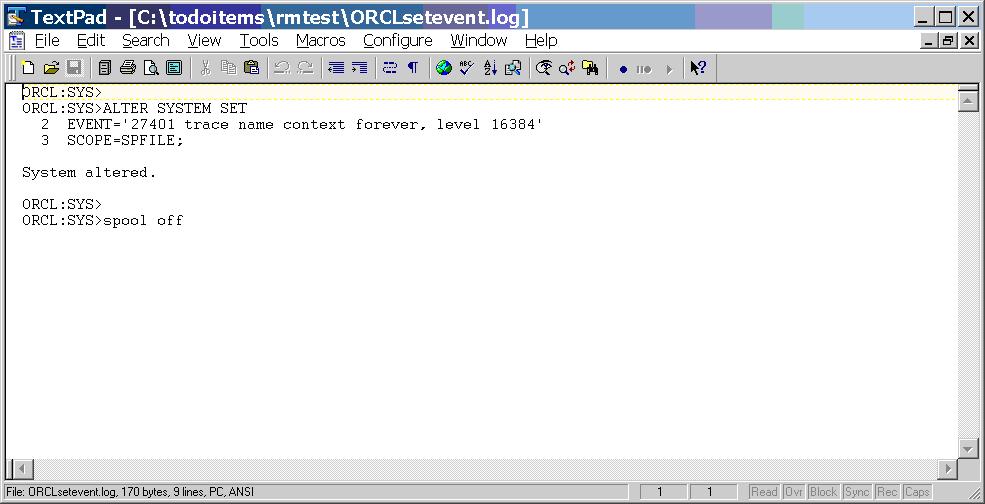
Set event and level.

boucetosetevent

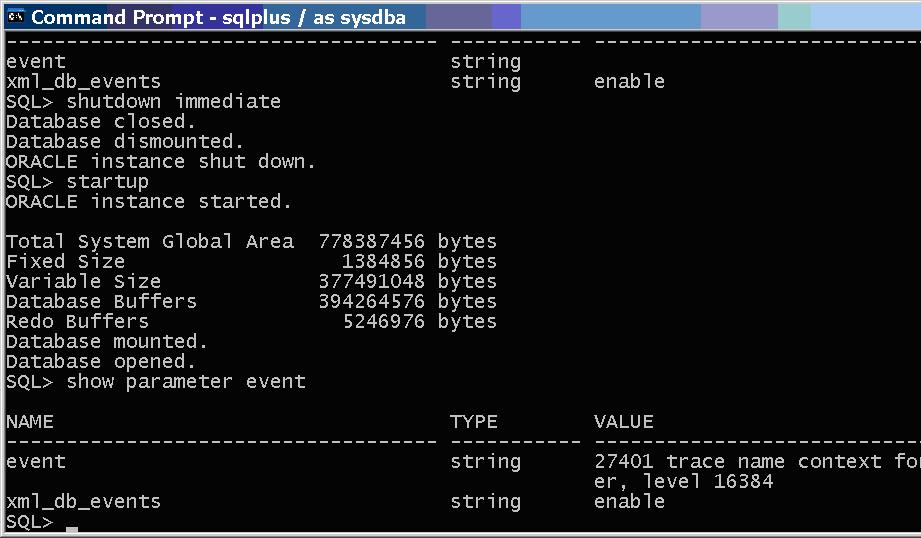
Had to bounce to get the event set.  Went through the entire process again and when the scheduler window opens the resource manager wait remains and the plan parameter is unchanged.

plandoesntchange

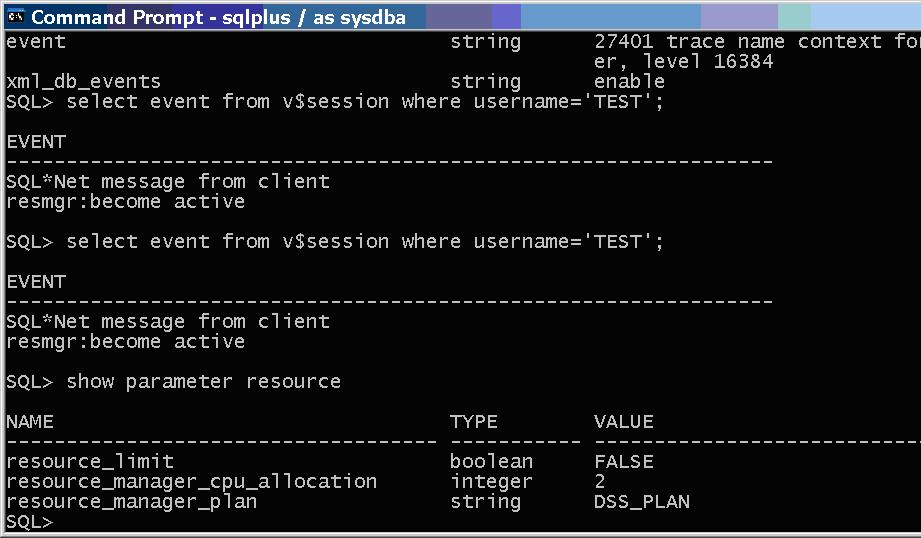
With active scheduler window and event and trace level set the plan doesn’t change.

I’m not sure how helpful this will be to people but I wanted to document this on the internet in case someone else has to deal with this event and trace level.  Here are my simple locking scripts for session 1 and session 2:

-- lock1.sql
-- session 1 creates table and updates a row grabbing a row lock

drop table test;
create table test (a number);
insert into test values (1);
commit;
update test set a=2;

-- lock2.sql
-- session 2 tries to hang on a row lock:

update test set a=2;

Lastly, please do not set this event and trace level on your system.  I do not know all that this event does and I suspect it is causing problems on our system.  All I know for sure is that it prevents the resource manager plan from changing when a scheduler window opens.  Who knows what other horrible consequences there may be from setting this undocumented event?  If you want to prevent the active plan from changing all you have to do is associate the plan you normally run with the scheduler window and it won’t change.  So, in my example if I associated DSS_PLAN with the scheduler window then when I opened the window the plan wouldn’t change.  This is much better than setting an undocumented event and trace level.

– Bobby

Posted in Uncategorized | Leave a comment

Choosing active plan with OEM puts instance name in spfile

I want to use this post to document a confusing issue we have had with the init parameter resource_manager_plan.  We had a situation where we had used an alter system command to set a particular plan to be active, but a different plan was active.  Also, this was on a two node RAC system and the nodes had different active plans.  The spfile had the parameter set one way for a given instance and also set for all instances another way.  It looks like OEM caused this issue by inserting the parameter into the spfile with the instance name on it.  So, if you use a combination of OEM and alter system commands to set the active resource manager plan take a good look at your spfile to make sure you don’t have conflicting settings.

I put together a quick example on a stand alone test database to demonstrate how this could happen.  I start out with no active plan.  I use this command to dump out the spfile in a text file on my C: drive:

create pfile='C:\todoitems\oemrmparameter\pfile1.txt' from spfile;

The parameter resource_manager_plan was not in the spfile initially.  So, then I set the plan DSS_PLAN active in OEM:

dss_plan

I chose DSS_PLAN and clicked on the “Go” button.

dss_plan2

Now DSS_PLAN is active.  When I look at the spfile it has the following parameters:

*.resource_manager_plan='DSS_PLAN'
orcl.resource_manager_plan='DSS_PLAN'

Note how both the *. and orcl. parameters are inserted.  Next I manually change the resource_manager_plan parameter using this alter system statement:

alter system set resource_manager_plan='' scope=both;

Then I bounce the database and which plan is active?  Still the DSS_PLAN.  Here is how the spfile looks now:

orcl.resource_manager_plan='DSS_PLAN'
*.resource_manager_plan=''

The orcl. parameter overrides the *. one so that is why it is running DSS_PLAN.  Then to cleanup I run these two commands to delete both entries from the spfile:

alter system reset resource_manager_plan scope=spfile sid='orcl';
alter system reset resource_manager_plan scope=spfile sid='*';

After bouncing the database you are back to the default INTERNAL_PLAN:

internal_plan

This may seem easy to avoid now that I’ve described the issue, but it was very confusing until I dumped out the spfile.  The key is that OEM will put the instance name on the parameter in the spfile.

– Bobby

Posted in Uncategorized | 2 Comments

cluster=no to speed Exadata datapump to ASM

This is a followup to my previous post about using a Datapump export to ASM on an Exadata system.  I’m finalizing my backup of a large table that I’m modifying this weekend. I’ve been comparing notes with another team member on how this table has been backed up in the past.  At one point in the past this table was backed up in 2.5 hours with a parallel 16 insert into an uncompressed table with parallel DML enabled.  But, I don’t want to create another copy of this huge table just to back it up, so that is why I’m looking at datapump.  But, my first test took 5.25 hours which seemed slower than the parallel insert.  My test was parallel=8 so it was half the parallelism of the previous parallel insert, but I don’t expect twice the parallelism to equal half the runtime so datapump still seems slower than the parallel insert.

Yesterday I remembered that there was a parameter you could stick in the datapump export parfile that would force all of the backup processes on a parallel export to stay on the node you ran datapump on.  In my previous test I was puzzled when I ran “top” during the export to find only four backup processes on node 1 where I ran my test.   Yesterday I ran an AWR report for both nodes covering the time frame of my datapump test and found both nodes with datapump activity.  So, the light clicked on and I found/remembered the cluster=no datapump parfile parameter setting.  I added this setting to my parfile, re-ran an export of the same table, and it ran in 4 hours instead of 5.25.  When I ran top on node 1 this time I saw 8 export processes running instead of four.

Here is my new parameter file, with the table name removed:

DIRECTORY=asm_dump
JOB_NAME=datapumptoasm_export2
DUMPFILE=datapumptoasm2%u.dmp
LOGFILE=asm_dump_log:expdp_datapumptoasm2.log
COMPRESSION=NONE
TABLES=(...put your table name here...)
PARALLEL=8
cluster=no

So, if you are doing parallel datapump export on a RAC or Exadata system you might try cluster=no to see if it speeds your export.  It appears to make the parallel uncompressed datapump export to ASM about the same speed as a parallel insert into an uncompressed table.

– Bobby


Posted in Uncategorized | 1 Comment

Reading Concepts Manual on Amazon Kindle

I got a Kindle for Christmas.  I thought I would enter the 21st century and try reading books on a Kindle, though I kind of like the feel of a real book.  One use I had in mind when I asked for Kindle as a present was to read Oracle manuals on it.  Since Oracle manuals no longer come printed as they did years ago if I want to sit down and read an entire chapter or even an entire book I can’t do that staring at a computer screen.  Of course it is great having the manuals online to look up details you need at the moment, but sometimes I want to read big chunks of the manual to learn a new topic or to review things I’ve read before and forgotten.  In the past I’ve just printed out a chapter at a time but that costs real money.

I downloaded the 11.2 concepts manual in Mobi format and emailed it to my username@free.kindle.com address.  I had to click into the html version of the manual on Oracle’s website to find a link for the Mobi version.  Here is the link to the manual in html:

http://docs.oracle.com/cd/E11882_01/server.112/e25789/toc.htm (NO LONGER EXISTS)

The upper right corner has the Mobi link on it.

When I tried reading the manual I found that it worked best with the default font size and changing the Kindle orientation so I held it sideways (i.e. longer lines, smaller number 0f lines).  This allowed the SQL examples to fit on the page.  The images were nice because you could see them pretty well by default and then clicking on them blew them up so you could see more detail.

I read one chapter just to see how comfortable it would be and it was good.  Maybe the Kindle will be my new method of reading manuals when I have a lot to cover.

– Bobby

P.S. Here is the 11.2 concepts manual on 4/26/21:

https://docs.oracle.com/cd/E11882_01/server.112/e40540/toc.htm

Seems like you can only download PDF today

Posted in Uncategorized | 3 Comments

Datapump to RECO ASM Diskgroup on Exadata

I have a large sub-partitioned table on our Exadata system that I need to backup prior to a change.  In the past we have done backups of this large table to another table using inserts and parallel DML,  but it just adds more data in our regular RMAN backups to have a copy of the original table sitting around as a backup.  It dawned on me that our Exadata systems have an empty RECO diskgroup in ASM.  We used to use RECO for RMAN backups to disk.  But now our RMAN backups are done another way and RECO sits empty.  Eventually we will probably reclaim the space in RECO by putting datafiles there.  But for now it is an opportunity.  Another factor is that we haven’t had any luck doing datapump backups to DBFS.  We have a large DBFS filesystem that we use to hold flat files for data loads but when we try to use it as a dumping ground for datapump we get wierd internal errors – probably some bug.  But, we haven’t tried datapumping straight to ASM, so that’s what I decided to try.  I found a nice blog post describing how to do this:

http://www.gloworld.co.uk/Home/datapump/datapump-notes/usingasmwithdatapump

I did essentially all the steps in that post with minor name changes and RECO as the diskgroup.  I also did a parallel export and just one big table.

Here was what I did in asmcmd:

ls
cd reco
mkdir dpdump

Here are my commands connected as SYSDBA:

create or replace directory ASM_DUMP as '+RECO/dpdump';
grant read,write on directory asm_dump to system;
create or replace directory ASM_DUMP_LOG as 
  '/home/oracle/datapumptoasm';
grant read,write on directory asm_dump_log to system;

Prior to running these I created the unix directory /home/oracle/datapumptoasm. Here is the parfile:

DIRECTORY=asm_dump
JOB_NAME=datapumptoasm_export
DUMPFILE=datapumptoasm%u.dmp
LOGFILE=asm_dump_log:expdp_datapumptoasm.log
COMPRESSION=NONE
TABLES=(...put your own table name here...)
PARALLEL=8

expdp system parfile=expdp_asm.par

It exported 1.7 terabytes in about 5.25 hours.  This was on a quarter rack Exadata V2.  Here is the end of the output log:

Master table "SYSTEM"."DATAPUMPTOASM_EXPORT" successfully 
  loaded/unloaded
***********************************************************
Dump file set for SYSTEM.DATAPUMPTOASM_EXPORT is:
  +RECO/dpdump/datapumptoasm01.dmp
  +RECO/dpdump/datapumptoasm02.dmp
  +RECO/dpdump/datapumptoasm03.dmp
  +RECO/dpdump/datapumptoasm04.dmp
  +RECO/dpdump/datapumptoasm05.dmp
  +RECO/dpdump/datapumptoasm06.dmp
  +RECO/dpdump/datapumptoasm07.dmp
  +RECO/dpdump/datapumptoasm08.dmp
Job "SYSTEM"."DATAPUMPTOASM_EXPORT" successfully completed 
  at 15:19:13

This might be worth a try if you have a bunch of free space in ASM as we do.

– Bobby


Posted in Uncategorized | 1 Comment

REGEXP_LIKE Example

This is simple, but fun.  I have studied the regular expression features in Oracle but haven’t really used them.  I needed a list of all the tables in a particular schema that started with a certain string and ended with three or four numbers but there were a number of other tables with similar patterns in the same schema – backups, etc.  I’ve done this before with LIKE and  % and _.  But I went to review the LIKE command in the manual and ran across REGEXP_LIKE and decided to try it.  It worked pretty well.  Easier to specify the same thing than with LIKE I think.  I ended up with a condition that would work with two or more numbers so it wasn’t exactly 3 or 4 numbers but all the tables I was looking for and none of the ones I didn’t need fit the regular expression.  I built a simple test case in my own test schema that mirrored the situation  on our real system and here is the resulting query and its output:

select table_name
from user_tables
where 
REGEXP_LIKE (table_name, '^TEST_[0-9][0-9]*[0-9]$')
order by table_name;

TABLE_NAME
------------------------------
TEST_123
TEST_4567

I had to have the ^ at the beginning and the $ at the end to indicate that the regular expression matched the entire table name. [0-9] matches one digit and  [0-9]* matches zero or more digits.  The _ in this example is just the literal character _ and doesn’t match anything else.

Here is a zip of my test script and its log.

– Bobby

Posted in Uncategorized | 13 Comments

Soft Parses

I’ve done a little research to figure out what a “soft parse” is because I’m working on a system that is experiencing performance issues doing soft parses.  My own translation is that a “soft parse” occurs whenever the Oracle optimizer has to examine the text of a SQL statement.  A “hard parse” is just a soft parse plus the creation of a new execution plan for the parsed SQL text.

The concepts manual describes a soft parse as the conversion of the SQL text into an internal data structure – presumably something tree like.  But what wasn’t clear to me was that even if a SQL statement has been run before and has its plan cached it still has to be parsed and the resulting data structure is used prior to looking up the pre-existing plan in the shared pool.  So, since we are having performance issues with soft parses how can we avoid them?  It seems like every time we run a SQL query you will have a parse of some type.  It turns out that in some cases the text of the query can be parsed once producing a cursor and then that cursor can be executed multiple times bypassing parsing altogether.

I built a test case to demonstrate soft and hard parses and cursors.

I used the following query to show the number of parses and executions of the test query.

select sn.name,ms.value
from V$MYSTAT ms,V$STATNAME sn
where
ms.STATISTIC#=sn.STATISTIC# and
(name like  '%parse%' or name = 'execute count');

First I run the query against dual 1000 times and it produces 1000 soft parses and executes:

SQL> CREATE OR REPLACE PROCEDURE testparse2(num_executions number)
       is
  2       dummy_var        VARCHAR2(1);
  3    BEGIN
  4  
  5       FOR i IN 1..num_executions LOOP
  6  
  7    -- run query normally
  8         SELECT dummy into dummy_var from dual;
  9  
 10       END LOOP;
 11  
 12    END;
 13  /

NAME                    VALUE
-----------------------------
parse count (total)        19
parse count (hard)          2
execute count              17

SQL> execute testparse2(1000);

NAME                    VALUE
-----------------------------
parse count (total)      1022
parse count (hard)          2
execute count            1020

Next I used DBMS_SQL to parse the SQL query once and execute it 1000 times producing 1000 executions.

SQL> CREATE OR REPLACE PROCEDURE testparse(num_executions number)
       is
  2       dummy_var        VARCHAR2(1);
  3       test_cursor      INTEGER;
  4       rows_fetched     NUMBER;
  5       ignore           INTEGER;
  6    BEGIN
  7  
  8    -- Prepare a cursor to select from the source table:
  9       test_cursor := dbms_sql.open_cursor;
 10       DBMS_SQL.PARSE(test_cursor,
 11            'SELECT dummy from dual',
 12            DBMS_SQL.NATIVE);
 13       DBMS_SQL.DEFINE_COLUMN(test_cursor, 1, dummy_var,1);
 14  
 15       FOR i IN 1..num_executions LOOP
 16  
 17    -- execute
 18         ignore := 
              DBMS_SQL.EXECUTE(test_cursor);
 19         rows_fetched := 
              DBMS_SQL.FETCH_ROWS(test_cursor);
 20         DBMS_SQL.COLUMN_VALUE(test_cursor, 1,
              dummy_var);
 21  
 22       END LOOP;
 23  
 24  
 25    -- close cursor
 26  
 27       DBMS_SQL.CLOSE_CURSOR(test_cursor);
 28    END;
 29  /

NAME                  VALUE
---------------------------
parse count (total)      19
parse count (hard)        2
execute count            17

SQL> execute testparse(1000);

NAME                   VALUE
----------------------------
parse count (total)       23
parse count (hard)         2
execute count           1020

FYI – I’ve edited the output a bit to make this more readable.  See the testcase for the exact output.  To make these results come out so cleanly I had to turn off session cursor caching with this command:

alter session set session_cached_cursors=0;

I turned this back on setting  session_cached_cursors=50 and the original loop worked almost as well as the one with DBMS_SQL:

NAME                           VALUE
------------------------------------
parse count (total)               19
parse count (hard)                 2
execute count                     17

SQL> execute testparse2(1000);

NAME                           VALUE
------------------------------------
parse count (total)               22
parse count (hard)                 2
execute count                   1020

So, the session cursor caching must work like my DBMS_SQL example in that it saves the cursor from the first parse of a SQL statement and executes it multiple times.  Lastly, just to show what I already know, that hard parses come from new SQL text that isn’t cached in any way I ran the following test with the cursor caching on:

SQL> CREATE OR REPLACE PROCEDURE testparse3(num_executions number)
       is
  2       dummy_var        VARCHAR2(80);
  3       query            varchar2(80);
  4    BEGIN
  5  
  6       FOR i IN 1..num_executions LOOP
  7        query := 'SELECT dummy||''a'||to_char(i)||''' from dual';
  8    -- add a unique table alias to force hard parse with each
  9    -- loop
 10        execute immediate query into dummy_var;
 11  
 12       END LOOP;
 13  
 14    END;
 15  /

NAME                            VALUE
-------------------------------------
parse count (total)                66
parse count (hard)                  2
execute count                      88

SQL> execute testparse3(1000);

NAME                            VALUE
-------------------------------------
parse count (total)              1069
parse count (hard)               1003
execute count                    1091

There are 1000 hard parses.  But, I can’t run this test script twice because the next time the hard parses disappear;

NAME                   VALUE
----------------------------
parse time cpu             1
parse time elapsed         5
parse count (total)     1022
parse count (hard)         2
parse count (failures)     0
parse count (describe)     0
execute count           1020

So, what’s the point of all this?  In my case we know a production system is spending a lot of time in soft parses waiting on library cache locks.  So, the problematic queries have been run before so they aren’t hard parses, but they aren’t cached in the session cursor cache.  It remains to be seen if this can help us track down the source of the problem but at least it helps explain where the time is spent.

– Bobby

Posted in Uncategorized | Leave a comment

SHARED_CONTEXT_SENSITIVE VPD policy type

The SHARED_CONTEXT_SENSITIVE VPD policy type seems like a good option for VPD predicates that don’t need to change during a user’s session.

I’m working on a system with VPD policies in place to cause users to see only certain parts of the data based on their job role.  But, we have configured these policies with the default policy type which is DYNAMIC.  We are seeing performance issues with parsing hanging up on library cache lock waits and various web sites and Oracle support have pointed to our use of DYNAMIC type policies as a potential source.  But, there are five different policy types and I wanted to understand the difference between the types and which would be best for our situation.  Based on my evaluation SHARED_CONTEXT_SENSITIVE looks best because it will result in the fewest calls to the predicate function and the fewest parses.  The only down side appears to be that if things change behind the scenes while you are logged in you will not see the new predicates until you log out and in again.

I put together a test case to try out each of the different policy types and summarized the results in a spreadsheet.  I created a policy function that would create a new predicate each time it was run if you waited at least a second between each run.  Then I associated the function with two identical tables which were copies of DBA_OBJECTS.  I did this for each of the five policy types: DYNAMIC, STATIC, SHARED_STATIC, CONTEXT_SENSITIVE, SHARED_CONTEXT_SENSITIVE.  Then I ran a count(*) query twice on each table.  Also, I created a second user and ran the same tests under the second user to see if logging in as a second user changed whether a new predicate was used or if the query was reparsed.  Here is a summary of the results:

Policy type user parses executions predicates
DYNAMIC TEST 5 13 4
DYNAMIC TEST2 4 14 4
STATIC TEST 2 7 2
STATIC TEST2 2 5 2
SHARED_STATIC TEST 2 6 1
SHARED_STATIC TEST2 2 5 0
CONTEXT_SENSITIVE TEST 4 9 4
CONTEXT_SENSITIVE TEST2 4 9 4
SHARED_CONTEXT_SENSITIVE TEST 2 6 1
SHARED_CONTEXT_SENSITIVE TEST2 2 6 1

DYNAMIC had the most parses and executions of the policy function.  SHARED_STATIC had the fewest, but the predicate didn’t change when we logged in as a new user.  CONTEXT_SENSITIVE was better than DYNAMIC on policy function executions but not on parses.  SHARED_CONTEXT_SENSITIVE came out best with fewer parses and policy function executions, but the predicate still changed when we logged in as a new user.

– Bobby


Posted in Uncategorized | Leave a comment

Index causes poor performance in query that doesn’t use it

I’ve been working for hours on a performance issue the past week and this one and found a strange situation:  A new function based index sped up the queries that used it, but slowed down other queries that didn’t use it.  I recreated the problem on an 11.1.0.7 database and I couldn’t recreate it on an 11.2.0.3 database.

The function based index was on an index organized table.  The plan with or without the index looks the same:

------------------------------------------------------
| Id  | Operation          | Name                    |
------------------------------------------------------
|   0 | SELECT STATEMENT   |                         |
|   1 |  SORT ORDER BY     |                         |
|*  2 |   INDEX UNIQUE SCAN| RTD_DOCUMENT_PK         |
|*  3 |    INDEX RANGE SCAN| RTD_DOCUMENT_IX_DOCDATE |
------------------------------------------------------

But the predicates change on the last two steps of the plan.  Here are the predicates without the index:

   2 - access(...deleted for clarity...)
   3 - access(...deleted for clarity...)
       filter(TO_CHAR("CUSTOMERKEY") LIKE '90467978%')

With the function based index:

   2 - access(...deleted for clarity...)
       filter(TO_CHAR("CUSTOMERKEY") LIKE '90467978%')
   3 - access(...deleted for clarity...)

Without the function based index the plan uses the second column of the normal index and with the FB index it doesn’t.  Here is the normal index:

CREATE INDEX RTD_DOCUMENT_IX_DOCDATE 
ON RTD_DOCUMENT
(DOCUMENTDATE, CUSTOMERKEY);

So, for some reason the existence of the function based index affected whether CUSTOMERKEY was retrieved from the secondary index or from the primary key.  The plan that retrieves CUSTOMERKEY from the primary key accesses many more buffers.  In our real production scenario it accessed 4,000,000 buffers with the function based index in place and 22,000 without it even though the function based index wasn’t used in either case.

– Bobby

P.S. Here is the testcase.

P.P.S.  I found one bug that sounded similar but it is supposed to be fixed in 10.2:

Bug 4198156

Index-only retrieval not chosen with IOT and function based index [ID 4198156.8]

Posted in Uncategorized | 2 Comments

DBMS_STATS queries invisible indexes

I thought that an invisible index was never queried, but that it was only maintained as the table was modified.  But, when you use the dbms_stats package to gather statistics on a table, including its indexes, the invisible indexes are queried and their statistics are updated.

Here is part of the output from my  test script:

SQL> select to_char(last_analyzed,'YYYY-MM-DD HH24:MI:SS'),
     VISIBILITY
  2  from user_indexes where index_name='TESTI';

TO_CHAR(LAST_ANALYZ VISIBILIT
------------------- ---------
2012-11-30 16:56:36 INVISIBLE

SQL> 
SQL> execute dbms_stats.gather_table_stats(NULL,'TEST');

PL/SQL procedure successfully completed.

SQL> 
SQL> select to_char(last_analyzed,'YYYY-MM-DD HH24:MI:SS'),
     VISIBILITY
  2  from user_indexes where index_name='TESTI';

TO_CHAR(LAST_ANALYZ VISIBILIT
------------------- ---------
2012-11-30 16:56:38 INVISIBLE

Notice that the last_analyzed seconds change when I gather stats on my test table.  It’s a bummer because you may not want to spend the resources updating the stats on large indexes that you never use such as primary key invisible indexes.  In our case this is on Exadata where we want to use smart scans and not use the index, but we want the primary key index to force uniqueness.

– Bobby

Posted in Uncategorized | 1 Comment