inode lock contention

In my forum discussion about free buffer waits I came across a term that I didn’t understand: “inode lock contention”.  I’m pretty sure I had seen this same term years ago on one of Steve Adams’ pages on IO.  But, I didn’t really understand what the term meant and so it was hard to understand whether this was something I was seeing on our production system that was experiencing “free buffer waits”.

First I had to figure out what an inode was.  I knew that it had something to do with the way Unix filesystems work but reading this article(NO LONGER EXISTS) really helped clear up what inodes are at least on HP-UX.  Inodes are small chunks of bytes that are used to define a Unix filesystem.  On HP-UX’s VxFS filesystems a type 1 inode can point to up to 10 extents of one or more contiguous 8K blocks on a large filesystem.  The filesystem I’ve been testing on appears to have 32 meg extents if I’m reading this output from lvdisplay correctly:

LV Size (Mbytes)            1472000
Current LE                  46000

Total size of 1,472,000 meg divided by 46,000 logical extents = 32 meg per extent.

Since the inode can point to 1 to 10 extents it could point to between 32 and 320 meg.

My test case had 15 tables that were more than 1 gigabytes each.  It seems like each table should span multiple inodes so even if there is locking at the inode level it looks like it won’t lock the entire table at once.  Still, it seems unlikely to me that every time a table is updated that reads from all the other parts of the table pointed to by the same inode are really blocked by an inode lock.  Yet that is what this document(NO LONGER EXISTS) suggests:

“During a read() system call, VxFS will acquire the inode lock in shared mode, allowing many processes to read a single file concurrently without lock contention. However, when a write() system call is made, VxFS will attempt to acquire the lock in exclusive mode. The exclusive lock allows only one write per file to be in progress at a time, and also blocks other processes reading the file. These locks on the VxFS inode can cause serious performance problems when there are one or more file writers and multiple file readers.”

It uses the term “file” but I assume if you have a large file that has multiple inodes it means it will lock just the pieces associated with the one inode that points to the blocks that are being written.  The article goes on to explain how you can use the “cio” option to enable concurrent IO and eliminate this inode contention preventing writers from blocking readers.  But, I’ve been testing with just the direct IO options and not the cio option and seeing great results.  So, would I see even better improvement with concurrent io?

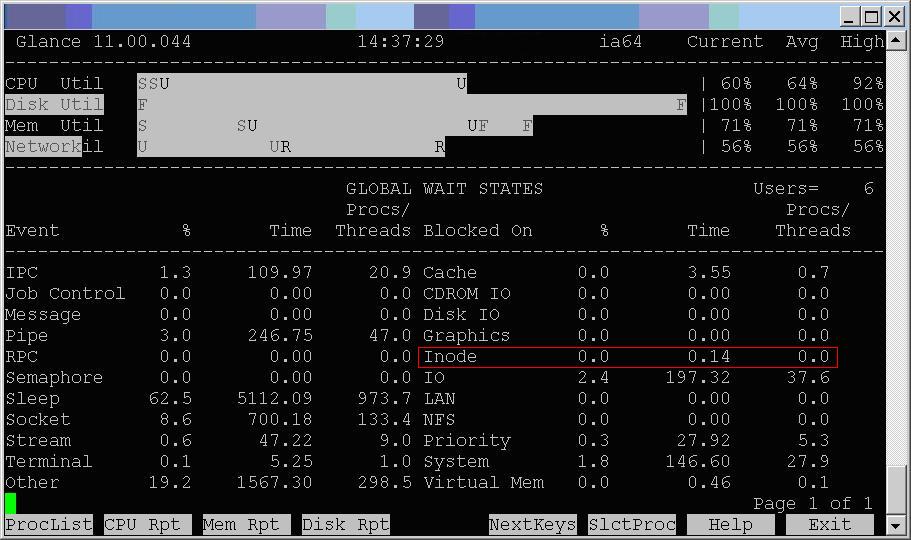
I didn’t want to mess with our current filesystem mount options since testing had proven them to be so effective but I found that in glance, a performance monitoring tool like top, you have an option to display inode waits.  So, I took a test that was running with direct IO and had 15 merge statements loading data into the same empty table at once and ran glance to see if there were any inode waits.  There were not:

inodewaits

So, I don’t know if I can depend on this statistic in glance or not.  It appears that the direct IO mount options are all we need:

mincache=direct,convosync=direct

filesystemio_options=DIRECTIO

There may be some case within Oracle 11.2.03 on HP-UX 11.31 where you can be hampered by inode lock contention despite having direct IO enabled but my tests have not confirmed it and I’ve banged pretty hard on my test system with a couple of different types of tests.

– Bobby

Posted in Uncategorized | 2 Comments

Interesting post on clustering factor

I just read this post about a new patch that will allow you to affect the way the optimizer calculates clustering factor and hence how likely it is to choose a particular index for a query plan.

http://richardfoote.wordpress.com/2013/05/08/important-clustering-factor-calculation-improvement-fix-you/

Pretty cool.  I haven’t tried it, but it looks promising.

– Bobby

Posted in Uncategorized | Leave a comment

Oracle internals web site

This is a good web site with Oracle internals information:

http://www.ixora.com.au/notes/ (NO LONGER EXISTS)

I’ve benefited from this one for years.

– Bobby

Posted in Uncategorized | Leave a comment

Direct IO and db_writer_processes=36 on HP-UX reduced free buffer waits

In my previous post I explained that setting db_writer_processes=1, dbwr_io_slaves=32 made a 2-3 times reduction in run time of my test of 15 concurrent updates.

Further testing has shown that an even greater improvement – really 10 times – can be made by switching to direct IO and maxing out the db writer processes.

To switch my test database to direct IO I had to do two things:

  1. Ask one of our Unix administrators to remount the filesystem that contains the datafile being tested using these options: mincache=direct,convosync=direct
  2. Change this parameter: filesystemio_options=directIO

Then I switched to what the documentation says is the maximum number of db writers:

  1. db_writer_processes=36
  2. dbwr_io_slaves=0

I had setup a test that generated free buffer waits by changing my update statements to update more blocks than could be held in the buffer cache and I had set log_checkpoint_interval back to its default of 0 so we wouldn’t get frequent checkpoints.  I also increased the redo logs to 2 gig so they wouldn’t switch and checkpoint frequently.  So, my test was getting plenty of free buffer waits and it took roughly 30 minutes for my 15 concurrent update statements to update 1 million rows each.  This was with my current production settings of db_writer_processes=4 and dbwr_io_slaves=0.

Here is a profile of the time spent by one update statement with no direct io and db_writer_processes=4 and dbwr_io_slaves=0:

TIMESOURCE                    SECONDS PERCENTAGE
-------------------------- ---------- ----------
TOTAL_TIME                       2503        100
free buffer waits                2097         84
db file scattered read            253         10
CPU                                61          2
UNACCOUNTED_TIME                   57          2
db file sequential read            26          1
latch: redo copy                    5          0
events in waitclass Other           2          0
log buffer space                    1          0

Here is a profile with the direct io options and db_writer_processes=36, dbwr_io_slaves=0:

TIMESOURCE                    SECONDS PERCENTAGE
-------------------------- ---------- ----------
TOTAL_TIME                        171        100
free buffer waits                  51         30
UNACCOUNTED_TIME                   41         24
db file scattered read             34         20
CPU                                23         13
log buffer space                   16          9
events in waitclass Other           3          2
latch: redo copy                    2          1

Incredible.  Thanks to Jonathan Lewis and Mark Powell for all of their patient discussion of this issue with me on our forum thread.

So, I guess the bottom line is that if you can’t get your filesystems mounted with direct IO options then the IO slaves may be the way to go in certain scenarios.  But, with direct IO it appears that upping the number of db writers is better than using IO slaves, at least in a scenario like mine were you have many concurrent updates filling the buffer cache with updated blocks and waiting on free buffer waits.

– Bobby

Posted in Uncategorized | 1 Comment

db_writer_processes, dbwr_io_slaves with no asynch I/O on HP-UX

I’m working on an HP-UX system that doesn’t have asynchronous I/O configured and I’m getting a bunch of “free buffer waits” which indicates that the DBWR processes are having trouble writing updated blocks from memory to disk fast enough.  Some preliminary testing I’ve done implies that I should change the following init.ora parameters: db_writer_processes, dbwr_io_slaves.  Our current settings in production are:

db_writer_processes=4, dbwr_io_slaves=0

In my test database these settings were 2-3 times faster when running 15 parallel update statements (each updating 100,000 rows):

db_writer_processes=1, dbwr_io_slaves=32

I also tried bumping the writer processes way up to these settings:

db_writer_processes=36, dbwr_io_slaves=0

but this didn’t help at all.

I engaged in a forum discussion with some very helpful people here: forum thread

Prior to the forum discussion I reviewed the manuals, Oracle’s support site, some blog postings and a usergroup presentation and was left with contradictory and confusing information on what settings to try for these two parameters.  I got the impression that increasing db_writer_processes would help but in my test it did not.

I can’t come to any firm conclusions except to recommend that if you don’t have asychronous I/O on HP-UX try setting db_writer_processes=1, dbwr_io_slaves=32 (some number > 0) and see if it helps.  Of course always try any change in a test environment before making the change in production.

– Bobby

P.S.  This query should show you if you datafiles are using asynch i/o:

select ASYNCH_IO,count(*) from v$iostat_file group by ASYNCH_IO;

Here is the output on our production server with the free buffer waits:

SQL> select ASYNCH_IO,count(*) from v$iostat_file 
group by ASYNCH_IO;

ASYNCH_IO   COUNT(*)
--------- ----------
ASYNC_OFF        301

On a system with asynch I/O it looks like this:

SQL> select ASYNCH_IO,count(*) from v$iostat_file 
group by ASYNCH_IO;

ASYNCH_IO   COUNT(*)
--------- ----------
ASYNC_OFF         10
ASYNC_ON          27

The 10 files with asynch off are not data files.

p.s.  Interestingly an 11.2 manual says that HP-UX doesn’t support asynch IO on filesystems.  I haven’t verified this with a test but it looks like your best bet on HP-UX would be to use raw devices and ASM with asynch IO.

Oracle® Database Administrator’s Reference
11g Release 2 (11.2) for Linux and UNIX-Based Operating Systems

“To use asynchronous Input-Output on HP-UX, you must use an Automatic Storage Management disk group that uses raw partitions as the storage option for database files.”

In my case I’m just looking for a quick boost to an existing system with datafiles on filesystems on HP-UX so maybe in this kind of special case setting db_writer_processes=1, dbwr_io_slaves > 0 makes sense.  At least it is worth a try.

Posted in Uncategorized | 4 Comments

DBA_HIST_SEG_STAT example

I used this query to debug some updating issues on a table:

select
ss.DATAOBJ#,
sn.END_INTERVAL_TIME,
ss.DB_BLOCK_CHANGES_DELTA,
ss.PHYSICAL_WRITES_DELTA
from 
DBA_HIST_SEG_STAT ss,
DBA_HIST_SNAPSHOT sn,
DBA_HIST_SEG_STAT_OBJ so
where 
so.OWNER='MYUSER' and
so.OBJECT_NAME='PLAN_TABLE' and
so.OBJECT_TYPE='TABLE' and
ss.OBJ#=so.OBJ# and
ss.DATAOBJ#=so.DATAOBJ# and
ss.snap_id=sn.snap_id
order by ss.snap_id,ss.DATAOBJ#;

This is just an example of a PLAN_TABLE in my schema.  I changed the schema name for security.  Here is edited output:

  DATAOBJ# END_INTERVAL_TIME         DB_BLOCK_CHANGES_DELTA PHYSICAL_WRITES_DELTA
---------- ------------------------- ---------------------- ---------------------
   2956377 17-APR-13 11.00.37.126 AM                     32                    11
   2956387 17-APR-13 11.00.37.126 AM                     16                     0
   2956389 17-APR-13 12.00.55.941 PM                     16                     8
   2956397 17-APR-13 12.00.55.941 PM                   3296                    35
   2956395 17-APR-13 02.00.31.239 PM                      0                     0

This could be useful to see when a given table was modified.

– Bobby

P.S. I think the DATAOBJ# changes when I truncate the table.  I usually truncate my PLAN_TABLE before doing a plan to make sure I don’t get an old plan by accident.


Posted in Uncategorized | Leave a comment

DBA_HIST_ACTIVE_SESS_HISTORY shows PeopleSoft OPRIDs

You can use DBA_HIST_ACTIVE_SESS_HISTORY to show details about the PeopleSoft operator id (OPRID) and which part of the online application they were in.  I was just looking at a Query Manager issue and found that DBA_HIST_ACTIVE_SESS_HISTORY populated these three columns with PeopleSoft specific information like this:

MODULE=QUERY_MANAGER

ACTION=QRY_SELECT

CLIENT_ID=OPRID of user running query manager

Pretty cool.  This is on HRMS 9.1 PeopleTools 8.50 Oracle database 11.2.0.3.

– Bobby

Posted in Uncategorized | Leave a comment

Don’t use TIME_WAITED in ASH views

I attended John Beresniewicz’s Active Session History (ASH)  talk at Collaborate 13 on Monday.  One simple point from it was that he commonly sees queries of the ASH views that use the TIME_WAITED column incorrectly and result in incorrect results.  The ASH views are V$ACTIVE_SESSION_HISTORY and DBA_HIST_ACTIVE_SESS_HISTORY.

I’ve used DBA_HIST_ACTIVE_SESS_HISTORY frequently to diagnose Oracle performance problems and I don’t believe that I use TIME_WAITED.  All I do is count up the number of rows in DBA_HIST_ACTIVE_SESS_HISTORY and count each row as 10 seconds of time.  This would be either time on the CPU or wait time.  Here is a query I recently used on a real performance problem:

select 
case SESSION_STATE
when 'WAITING' then event
else SESSION_STATE
end TIME_CATEGORY,
(count(*)*10) seconds
from DBA_HIST_ACTIVE_SESS_HISTORY a,
V$INSTANCE i,
dba_users u
where 
a.user_id = u.user_id and
a.instance_number = i.instance_number and
a.user_id = u.user_id and
sample_time 
between 
to_date('2013-04-02 00:00','YYYY-MM-DD HH24:MI')
and 
to_date('2013-04-02 22:00','YYYY-MM-DD HH24:MI')
and
a.sql_id = 'c12m4zxj3abm6'
group by SESSION_STATE,EVENT
order by seconds desc;

Disregard the joins to dba_users and v$instance.  These are left over from previous uses of this query.  Here is the output:

TIME_CATEGORY                     SECONDS
------------------------------ ----------
free buffer waits                   49110
db file parallel read               11310
write complete waits                 1810
db file sequential read              1600
ON CPU                                720
read by other session                 220
PX qref latch                          50
db file scattered read                 20
direct path read temp                  20
latch: redo allocation                 10
latch: cache buffers lru chain         10

An AWR report from 00:00 to 21:00 the same day  showed this sql_id with one execution of length 50,540.80 seconds that didn’t finish.  So, this roughly corresponds to the numbers in the ASH profile query above.  About 49,000 of the 60,000 seconds of run time are accounted for by free buffer waits.  We believe this is caused by too frequent checkpointing but haven’t verified it yet with a fix in production.

Anyway, this type of query was useful to me and it didn’t use the TIME_WAITED column so it validates to some extent the notion that you don’t need to use TIME_WAITED on the ASH views to have a useful query.

– Bobby

Posted in Uncategorized | 3 Comments

Lessons from preparing my Exadata talk

Well, I’m giving this talk related to Exadata at the Collaborate 13 usergroup conference on Monday.  I’ve spent a lot of time – probably too much time – preparing the slides and practicing the talk.  I first gave this talk a year ago at our office and then again last October at a conference in North Carolina.  But, I’ve never been happy with it.  I feel a lot better about it now because the slides and the associated notes have a lot of information on them.  I got a lot of great feedback from several people and I’ve made changes accordingly.

But having spent too much time reviewing this I think there are a small number of important concepts that I’m really trying to get across:

  1. Exadata Smart Scans bypass the block buffer cache
  2. Exadata Smart Scans happen instead of FULL scans
  3. Make indexes invisible or increase optimizer_index_cost_adj to encourage FULL scans
  4. Exadata Smart Scans tend to be part of a HASH JOIN
  5. HASH JOINs can be sped up by adding PGA memory – pga_aggregate_target
  6. You can free memory by reducing the size of the block buffer cache – sga_max_size

So, this is the short version of my 45 minute talk  More PGA, less SGA – my talk in four words!

– Bobby

Posted in Uncategorized | Leave a comment

Yet another Exadata slides update

Link to the latest version of my Exadata talk slides: zip

Here are the details of my presentation time and place if you are going to Collaborate 13 in Denver:

Session title: Exadata Distinctives
Room: Mile High Ballroom 1C
Date and Time: 1:15PM-2:15PM

I look forward to seeing you there!

– Bobby

PS. Minor revision today 04/04/2013.  Got to practice with a few coworkers listening.  Feel like this is it for the slides.

Posted in Uncategorized | Leave a comment