The developers complained that their test database was so much slower than production that they could not use it to really test whether their batch processes would run fast enough when migrated to production. They did not give me any particular queries to check. Instead they said that the system was generally too slow. So, I went through a process to find SQL statements that they had run in test and that normally run in production and compare their run times. I thought that I would document the process that I went through here.
First I found the top 100 queries by elapsed time on both the test and production databases using this query:
column FORCE_MATCHING_SIGNATURE format 99999999999999999999

select FORCE_MATCHING_SIGNATURE from
(select
FORCE_MATCHING_SIGNATURE,
sum(ELAPSED_TIME_DELTA) total_elapsed
from DBA_HIST_SQLSTAT
where
FORCE_MATCHING_SIGNATURE is not null and
FORCE_MATCHING_SIGNATURE <>0
group by FORCE_MATCHING_SIGNATURE
order by total_elapsed desc)
where rownum < 101;
The output looked like this:
FORCE_MATCHING_SIGNATURE
------------------------
      944718698451269965
     4634961225655610267
    15939251529124125793
    15437049687902878835
     2879196232471320459
    12776764566159396624
    14067042856362022182
...
Then I found the signatures that were in common between the two lists.
insert into test_sigs values (944718698451269965);
insert into test_sigs values (4634961225655610267);
insert into test_sigs values (15939251529124125793);
...
insert into prod_sigs values (3898230136794347827);
insert into prod_sigs values (944718698451269965);
insert into prod_sigs values (11160330134321800286);
...
select * from test_sigs
intersect
select * from prod_sigs;
This led to 32 values of FORCE_MATCHING_SIGNATURE which represented queries that ran on both test and production, except for the possible difference in constants.
Next I looked at the overall performance of these 32 queries in test and production using this query:
create table common_sigs
(FORCE_MATCHING_SIGNATURE number);

insert into common_sigs values (575231776450247964);
insert into common_sigs values (944718698451269965);
insert into common_sigs values (1037345866341698119);
...

select
sum(executions_delta) total_executions,
sum(ELAPSED_TIME_DELTA)/(sum(executions_delta)*1000),
sum(CPU_TIME_DELTA)/(sum(executions_delta)*1000),
sum(IOWAIT_DELTA)/(sum(executions_delta)*1000),
sum(CLWAIT_DELTA)/(sum(executions_delta)*1000),
sum(APWAIT_DELTA)/(sum(executions_delta)*1000),
sum(CCWAIT_DELTA)/(sum(executions_delta)*1000),
sum(BUFFER_GETS_DELTA)/sum(executions_delta),
sum(DISK_READS_DELTA)/sum(executions_delta),
sum(ROWS_PROCESSED_DELTA)/sum(executions_delta)
from DBA_HIST_SQLSTAT ss,common_sigs cs
where
ss.FORCE_MATCHING_SIGNATURE = cs.FORCE_MATCHING_SIGNATURE;
Here is part of the output:
TOTAL_EXECUTIONS Elapsed Average ms CPU Average ms IO Average ms
---------------- ------------------ -------------- -------------
         5595295         366.185529      241.92785    59.8682797
          430763         1273.75822     364.258421    1479.83294
The top line is production and the bottom is test.
This result supported the development team’s assertion that test was slower than production. The 32 queries averaged about 3.5 times longer run times in test than in production. Also, the time spent on I/O was about 25 times worse. I am not sure why the I/O time exceeded the elapsed time on test. I guess it has something to do with how Oracle measures I/O time. But clearly on average these 32 queries are much slower on test and I/O time probably caused most of the run time difference.
After noticing this big difference between test and production I decided to get these same sorts of performance metrics for each signature to see if certain ones were worse than others. The query looked like this:
select
ss.FORCE_MATCHING_SIGNATURE,
sum(executions_delta) total_executions,
sum(ELAPSED_TIME_DELTA)/(sum(executions_delta)*1000),
sum(CPU_TIME_DELTA)/(sum(executions_delta)*1000),
sum(IOWAIT_DELTA)/(sum(executions_delta)*1000),
sum(CLWAIT_DELTA)/(sum(executions_delta)*1000),
sum(APWAIT_DELTA)/(sum(executions_delta)*1000),
sum(CCWAIT_DELTA)/(sum(executions_delta)*1000),
sum(BUFFER_GETS_DELTA)/sum(executions_delta),
sum(DISK_READS_DELTA)/sum(executions_delta),
sum(ROWS_PROCESSED_DELTA)/sum(executions_delta)
from DBA_HIST_SQLSTAT ss,common_sigs cs
where ss.FORCE_MATCHING_SIGNATURE = cs.FORCE_MATCHING_SIGNATURE
having
sum(executions_delta) > 0
group by
ss.FORCE_MATCHING_SIGNATURE
order by
ss.FORCE_MATCHING_SIGNATURE;
I put together the outputs from running this query on test and production and lined the result up like this:
FORCE_MATCHING_SIGNATURE    PROD Average ms    TEST Average ms
------------------------ ------------------ ------------------
      575231776450247964         20268.6719         16659.4585
      944718698451269965         727534.558          3456111.6 *
     1037345866341698119         6640.87641         8859.53518
     1080231657361448615         3611.37698         4823.62857
     2879196232471320459         95723.5569         739287.601 *
     2895012443099075884         687272.949         724081.946
     3371400666194280661         1532797.66         761762.181
     4156520416999188213         109238.997         213658.722
     4634693999459450255          4923.8897         4720.16455
     5447362809447709021         2875.37308          2659.5754
     5698160695928381586         17139.6304         16559.1932
     6260911340920427003         290069.674         421058.874 *
     7412302135920006997         20039.0452         18951.6357
     7723300319489155163         18045.9756         19573.4784
     9153380962342466451         1661586.53         1530076.01
     9196714121881881832         5.48003488         5.13169472
     9347242065129163091         4360835.92         4581093.93
    11140980711532357629         3042320.88         5048356.99
    11160330134321800286         6868746.78         6160556.38
    12212345436143033196          5189.7972         5031.30811
    12776764566159396624         139150.231         614207.784  *
    12936428121692179551         3563.64537         3436.59365
    13637202277555795727          7360.0632         6410.02772
    14067042856362022182         859.732015         771.041714
    14256464986207527479         51.4042938         48.9237251
    14707568089762185958         627.586095          414.14762
    15001584593434987669         1287629.02         1122151.35
    15437049687902878835         96014.9782         996974.876  *
    16425440090840528197         48013.8912         50799.6184
    16778386062441486289         29459.0089         26845.8327
    17620933630628481201         51199.0511         111785.525  *
    18410003796880256802         581563.611         602866.609
I put an asterisk (*) beside the six queries that were much worse on test than production. I decided to focus on these six to get to the bottom of the reason between the difference. Note that many of the 32 queries ran about the same on test as prod so it really isn’t the case that everything was slow on test.
Now that I had identified the 6 queries I wanted to look at what they were spending their time on including both CPU and wait events. I used the following query to use ASH to get a profile of the time spent by these queries on both databases:
select
case SESSION_STATE
when 'WAITING' then event
else SESSION_STATE
end TIME_CATEGORY,
(count(*)*10) seconds
from DBA_HIST_ACTIVE_SESS_HISTORY
where
FORCE_MATCHING_SIGNATURE in
('944718698451269965',
'2879196232471320459',
'6260911340920427003',
'12776764566159396624',
'15437049687902878835',
'17620933630628481201')
group by SESSION_STATE,EVENT
order by seconds desc;
The profile looked like this in test:
TIME_CATEGORY            SECONDS
------------------------ -------
db file parallel read     207450
ON CPU                    141010
db file sequential read    62990
direct path read           36980
direct path read temp      29240
direct path write temp     23110
The profile looked like this in production:
TIME_CATEGORY            SECONDS
------------------------ -------
ON CPU                    433260
PX qref latch              64200
db file parallel read      35730
db file sequential read    14360
direct path read           12750
direct path write temp     12000
So, I/O waits dominate the time on test but not production. Since db file parallel read and db file sequential read were the top I/O waits for these 6 queries I used ash to see which of the 6 spent the most time on these waits.
db file parallel read:
select
  2  sql_id,
  3  (count(*)*10) seconds
  4  from DBA_HIST_ACTIVE_SESS_HISTORY
  5  where
  6  FORCE_MATCHING_SIGNATURE in
  7  ('944718698451269965',
  8  '2879196232471320459',
  9  '6260911340920427003',
 10  '12776764566159396624',
 11  '15437049687902878835',
 12  '17620933630628481201') and
 13  event='db file parallel read'
 14  group by sql_id
 15  order by seconds desc;

SQL_ID           SECONDS
------------- ----------
ak2wk2sjwnd34     159020
95b6t1sp7y40y      37030
brkfcwv1mqsas      11370
7rdc79drfp28a         30
db file sequential read:
select
  2  sql_id,
  3  (count(*)*10) seconds
  4  from DBA_HIST_ACTIVE_SESS_HISTORY
  5  where
  6  FORCE_MATCHING_SIGNATURE in
  7  ('944718698451269965',
  8  '2879196232471320459',
  9  '6260911340920427003',
 10  '12776764566159396624',
 11  '15437049687902878835',
 12  '17620933630628481201') and
 13  event='db file sequential read'
 14  group by sql_id
 15  order by seconds desc;

SQL_ID           SECONDS
------------- ----------
95b6t1sp7y40y      26840
ak2wk2sjwnd34      22550
6h0km9j5bp69t      13300
brkfcwv1mqsas        170
7rdc79drfp28a        130
Two queries stood out at the top waiters on these two events: 95b6t1sp7y40y and ak2wk2sjwnd34. Then I just ran my normal sqlstat query for both sql_ids for both test and production to find out when they last ran. Here is what the query looks like for ak2wk2sjwnd34:
select ss.sql_id,
ss.plan_hash_value,
sn.END_INTERVAL_TIME,
ss.executions_delta,
ELAPSED_TIME_DELTA/(executions_delta*1000) "Elapsed Average ms",
CPU_TIME_DELTA/(executions_delta*1000) "CPU Average ms",
IOWAIT_DELTA/(executions_delta*1000) "IO Average ms",
CLWAIT_DELTA/(executions_delta*1000) "Cluster Average ms",
APWAIT_DELTA/(executions_delta*1000) "Application Average ms",
CCWAIT_DELTA/(executions_delta*1000) "Concurrency Average ms",
BUFFER_GETS_DELTA/executions_delta "Average buffer gets",
DISK_READS_DELTA/executions_delta "Average disk reads",
ROWS_PROCESSED_DELTA/executions_delta "Average rows processed"
from DBA_HIST_SQLSTAT ss,DBA_HIST_SNAPSHOT sn
where ss.sql_id = 'ak2wk2sjwnd34'
and ss.snap_id=sn.snap_id
and executions_delta > 0
and ss.INSTANCE_NUMBER=sn.INSTANCE_NUMBER
order by ss.snap_id,ss.sql_id;
I found two time periods where both of these queries were recently run on both test and production and got an AWR report for each time period to compare them.
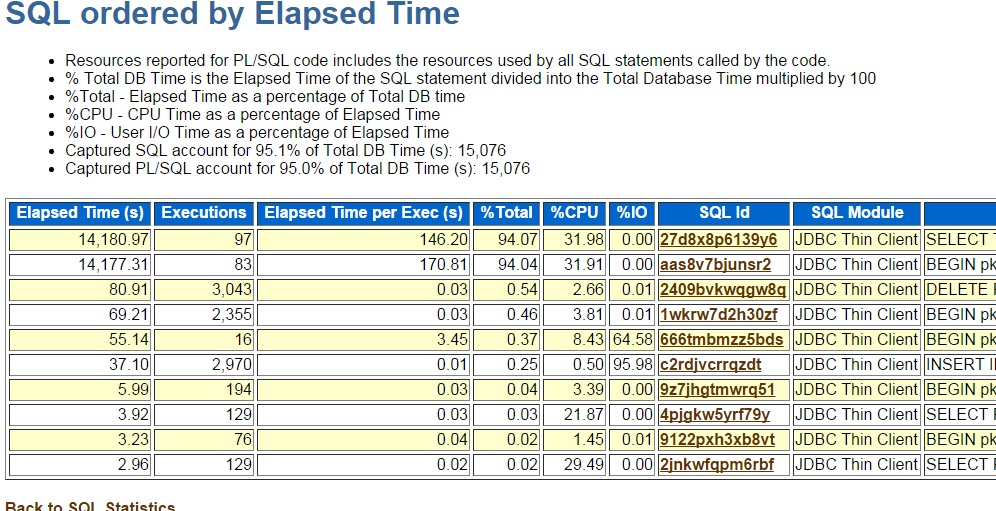
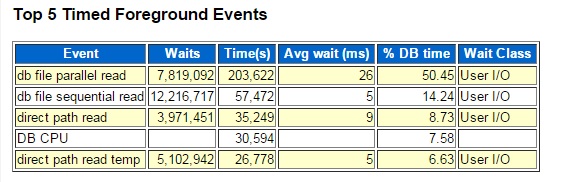
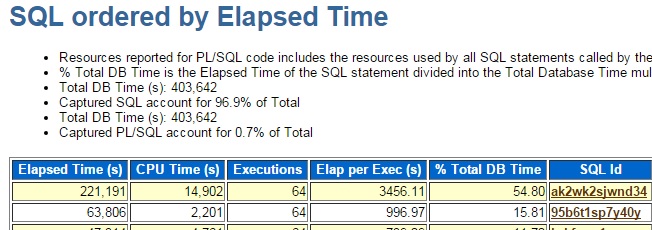
Here are a couple of pieces of the AWR report for the test database:
Here are similar pieces for the production database:
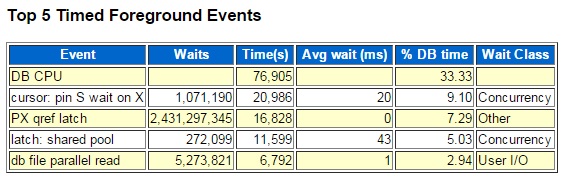
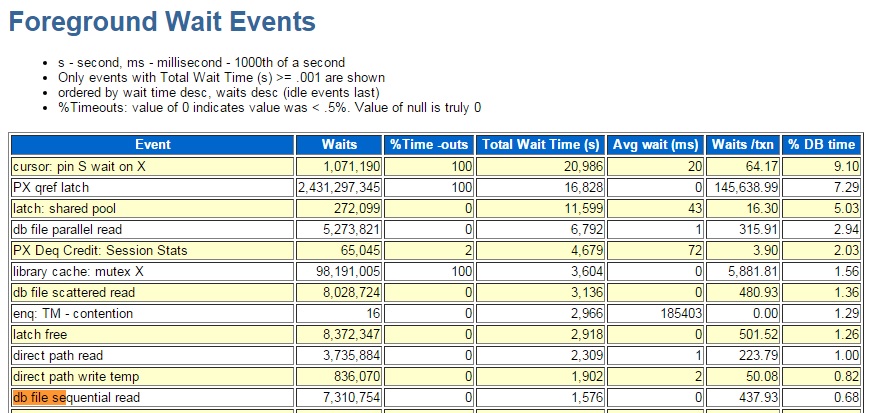
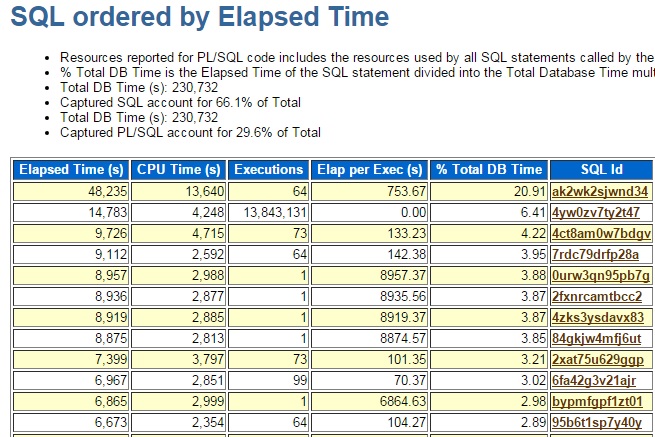
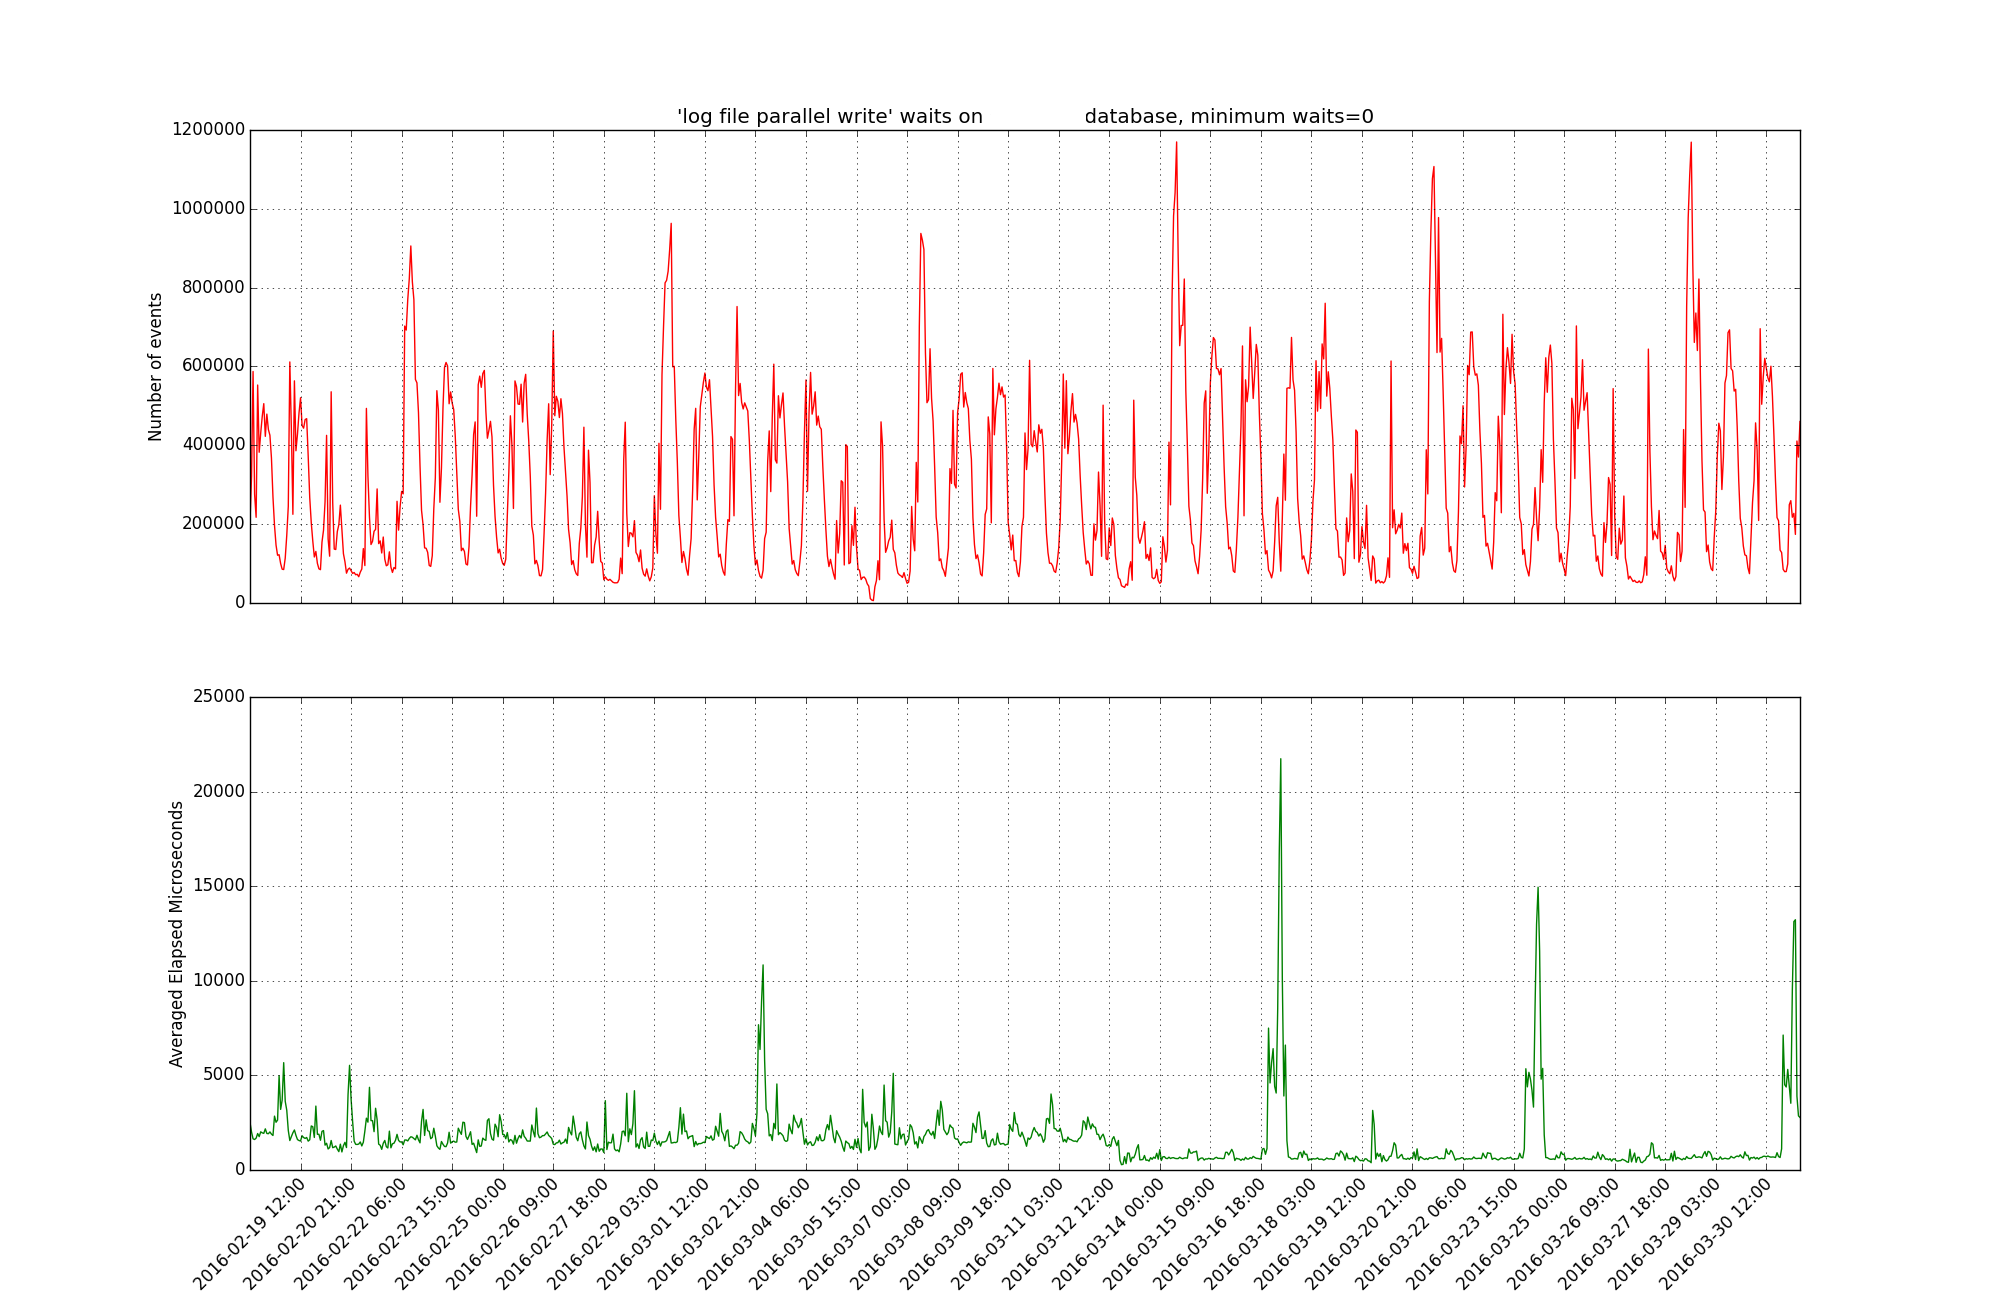
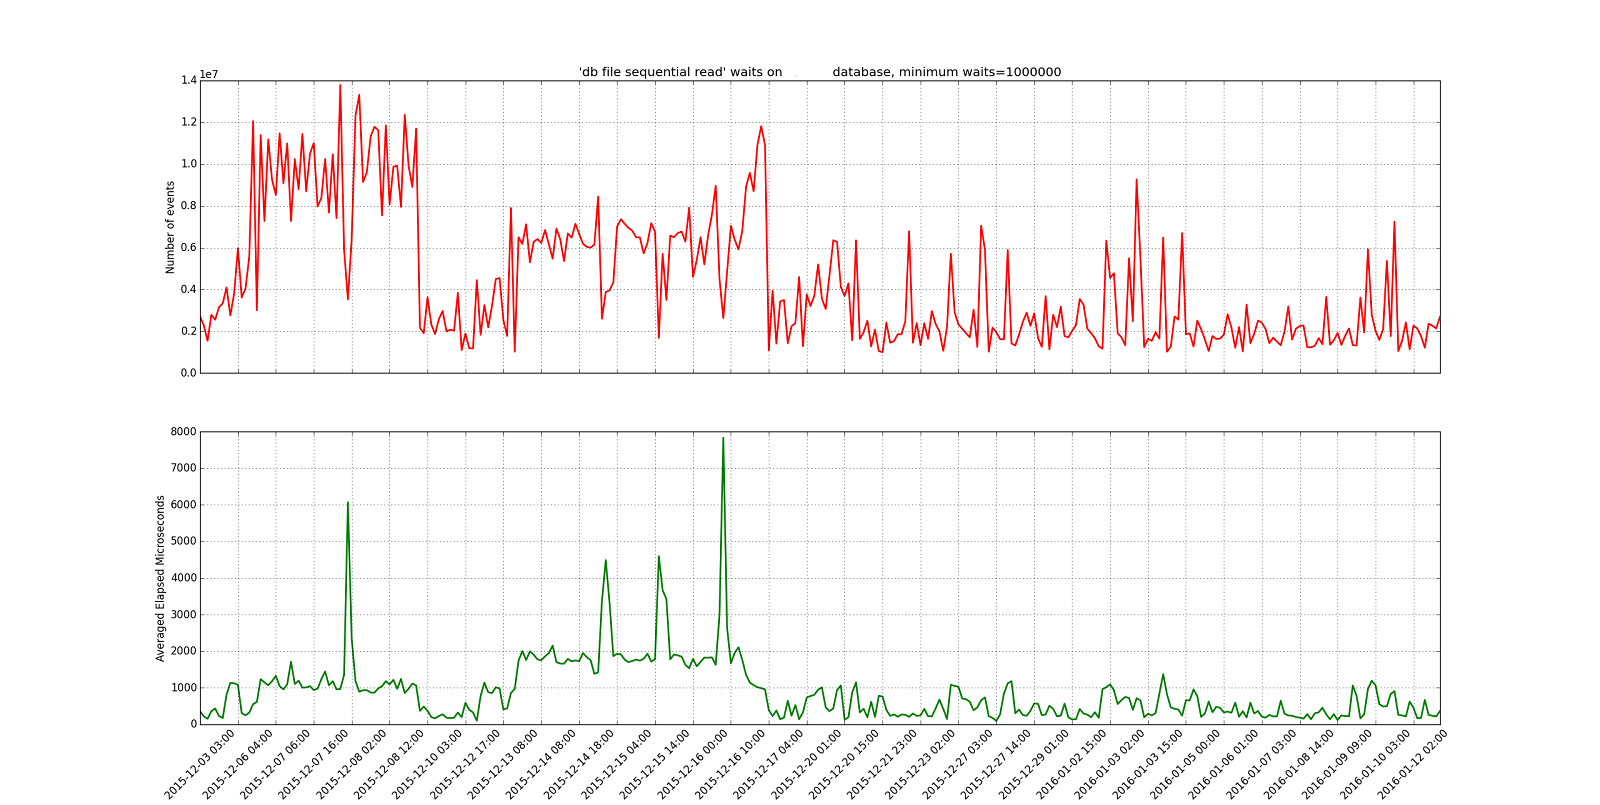
What really stood out to me was that the wait events were so different. In production the db file parallel read waits averaged around 1 millisecond and the db file sequential reads averaged under 1 ms. On test they were 26 and 5 milliseconds, respectively. The elapsed times for sql_ids 95b6t1sp7y40y and ak2wk2sjwnd34 were considerably longer in test.
This is as far as my investigation went. I know that the slowdown is most pronounced on the two queries and I know that their I/O waits correspond to the two wait events. I am still trying to find a way to bring the I/O times down on our test database so that it more closely matches production. But at least I have a more narrow focus with the two top queries and the two wait events.
Bobby