Before I left for vacation I noticed this blog post about setting up a network on VirtualBox: “CREATING A TEST LAB USING VIRTUALBOX / NAT NETWORKING”(DOES NOT EXIST). Now that I am back in the office I thought I would try to apply some of the things that I learned from the blog post to my existing VirtualBox network. I’m pretty happy with the results so I thought I would document my experience here.
My situation differed slightly from the situation in the original post:
- I’m using VirtualBox 5.1.12 instead of 5.0.4
- I’m using Oracle Enterprise Linux 7.3 instead of CentOs 6
- I have 6 existing VMs instead of starting from scratch
I was cautious at first about trying the things recommended in the post because I didn’t want to mess up my existing VMs. These are all just test environments but it took some work to set them up. But, I wasn’t happy with the way the network was setup on my VMs so that motivated me to try something different. My biggest problem with my network was that I couldn’t SSH into my VMs when I worked from home using my work VPN connection.
After re-configuring my network I now have a static ip address for each VM within its own NAT network and I have port forwarding setup so that I can SSH into each one even when I’m working from home using VPN into my company’s network. I also have port forwarding so that I can login to an Oracle database on one of the VMs from my laptop even when using VPN.
The original blog post has most of the details but I thought that I would document a few minor differences that I came across to be helpful.
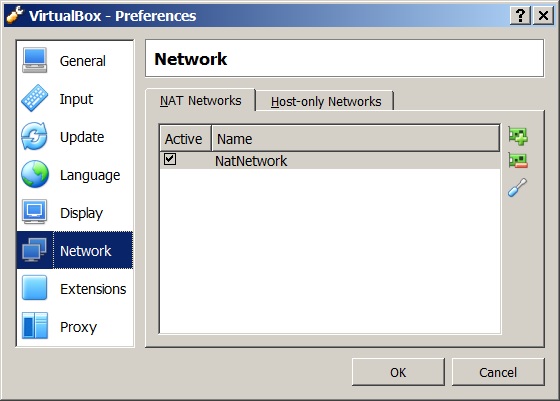
Default network name was NatNetwork instead of LocalNat.
In port forwarding I forwarded a port to port 1521 on the VM that has an Oracle database. I had to disable and stop the firewall on that VM so that I could connect to the Oracle database.
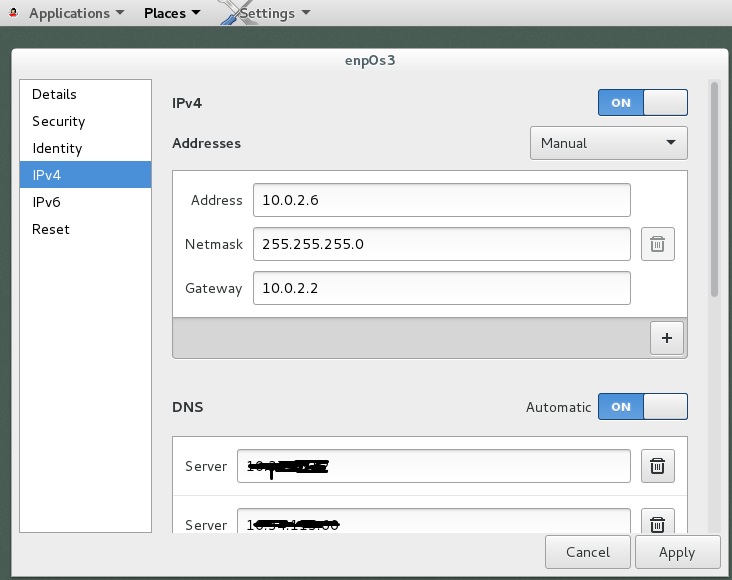
I went to /etc/sysconfig/network-scripts and looked at the configuration file and the format wasn’t the same as in the original post. This is probably because it is OEL 7.3 instead of CentOs 6. Instead of editing the file manually I ended up using the graphical network configuration app so that I knew I would edit the configuration correctly.
Later, after I wrote the first draft of this blog post I realized that I wanted to set up the network so that it automatically appends a domain name for our internal systems. I.e. if my standard domain is mycompany.com and I want to connect to mymachine.mycompany.com it would be nice to just connect to mymachine without fully qualifying the name with the domain. I ended up manually editing the file /etc/sysconfig/network-scripts/ifcfg-enp0s3 after googling around on the Internet to see how to add this. I added a DOMAIN line like this:
DOMAIN=”mydomain1.com mydomain2.com”
I created two text files to keep track of two things about my network configuration:
- The ports that VirtualBox forwards
- The ip address for each vm
I had to get the DNS server ip addresses from my laptop’s network settings.
Anyway, I don’t have much to add to the original post except just to point out these slight differences and my experience. It was super helpful to switch to this NAT network with port forwarding approach.
Bobby
P.S. After writing the first draft of this blog post I did some more testing. There is one thing about this configuration that I don’t like. It seems that anyone on my company’s network can SSH into one of my VMs if they use the forwarded port number and my laptop’s IP address. I tried this from one of our Unix servers and it worked disturbingly well, even over the VPN. I think that the original blog post wanted this behavior but I was just trying to connect from my laptop to my VMs when I was using VPN. Still, it might come in handy to SSH into my VMs from other computers on our network. At least it isn’t opening up every port on my VM – only the ones I have set up with port forwarding. Also, I usually only bring these VMs up for short periods of time so they wont be available for people to hack into except for short unpredictable intervals and when I’m actively using them.