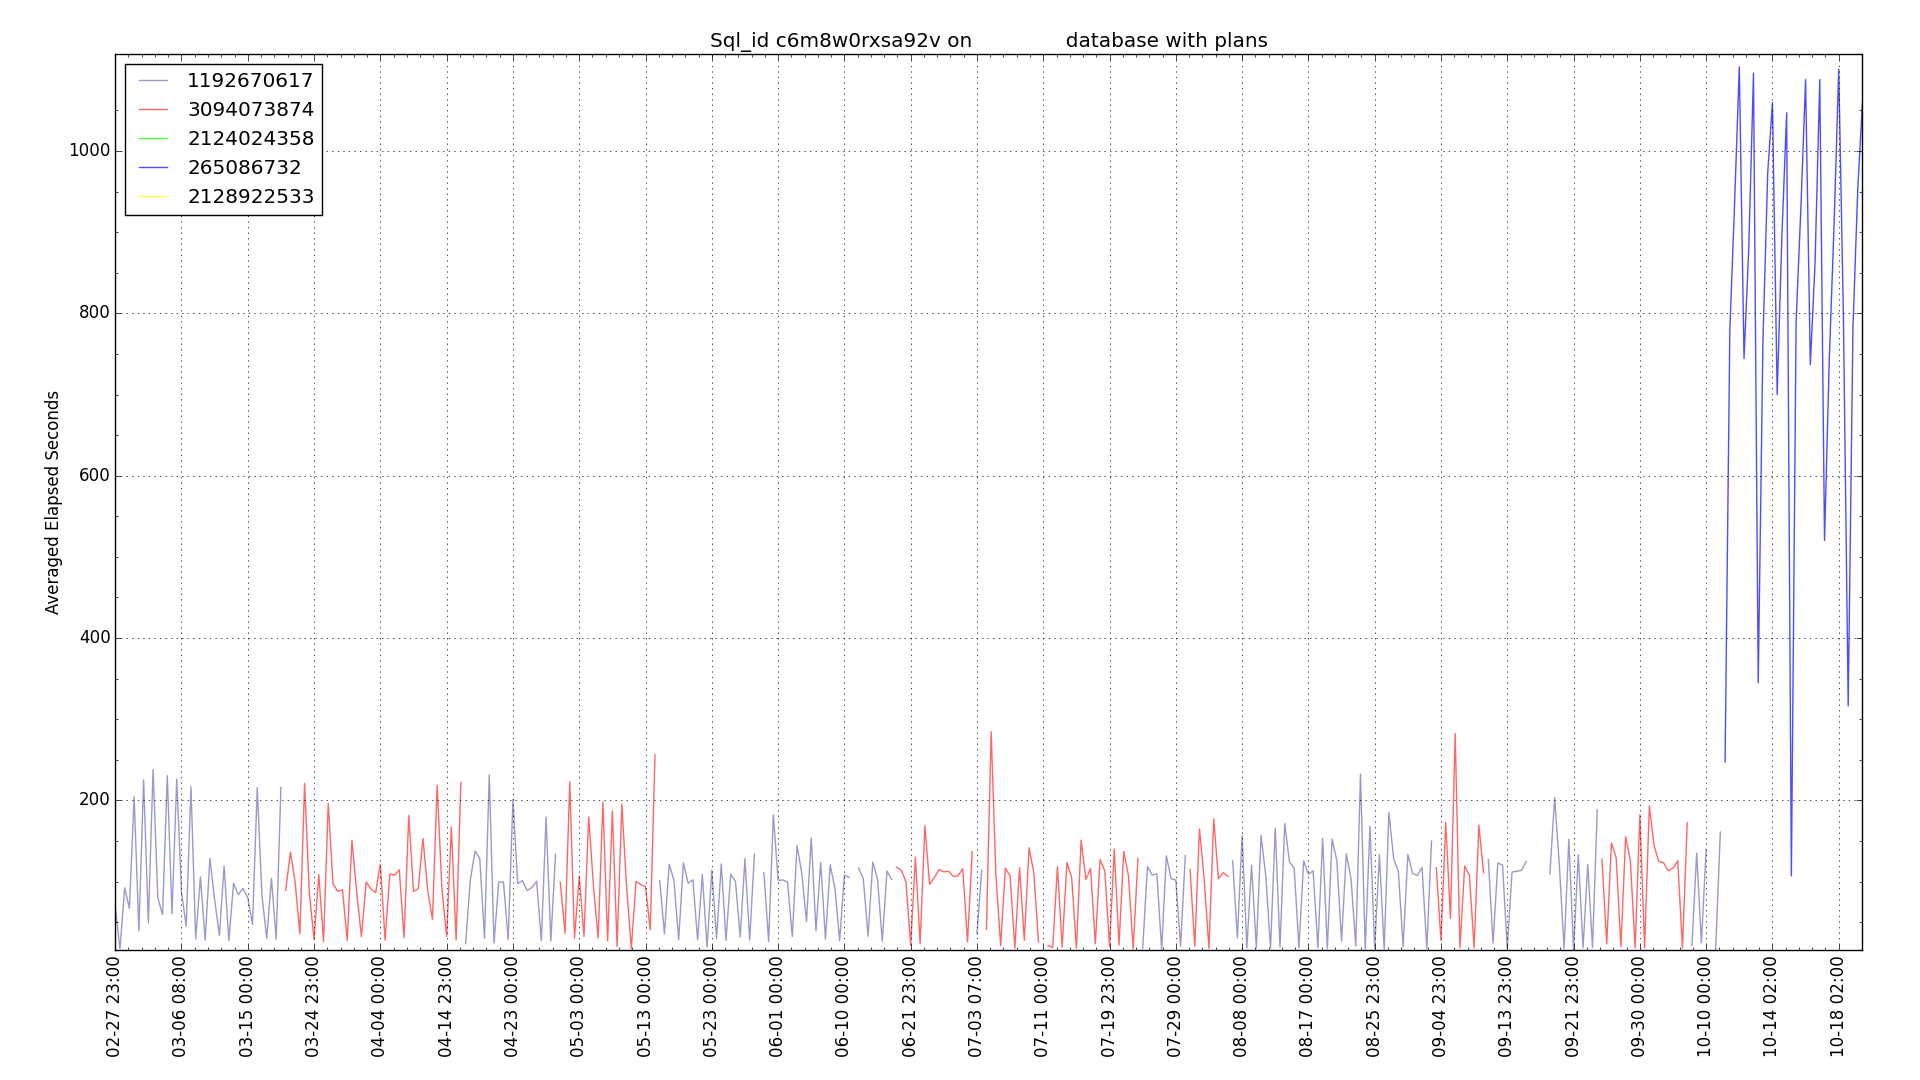
I created a new graph in my PythonDBAGraphs to show how a plan change affected execution time. The legend in the upper left is plan hash value numbers. Normally I run the equivalent as a sqlplus script and just look for plans with higher execution times. I used it today for the SQL statement with SQL_ID c6m8w0rxsa92v. It has been running slow since 10/11/2016.
Since I just split up my Python graphs into multiple smaller scripts I decided to build this new Python script to see how easy it would be to show the execution time of the SQL statement for different plans graphically. It was not hard to build this. Here is the script (sqlstatwithplans.py):
import myplot
import util

def sqlstatwithplans(sql_id):
    q_string = """
select
to_char(sn.END_INTERVAL_TIME,'MM-DD HH24:MI') DATE_TIME,
plan_hash_value,
ELAPSED_TIME_DELTA/(executions_delta*1000000) ELAPSED_AVG_SEC
from DBA_HIST_SQLSTAT ss,DBA_HIST_SNAPSHOT sn
where ss.sql_id = '"""
    q_string += sql_id
    q_string += """'
and ss.snap_id=sn.snap_id
and executions_delta > 0
and ss.INSTANCE_NUMBER=sn.INSTANCE_NUMBER
order by ss.snap_id,ss.sql_id,plan_hash_value"""
    return q_string

database,dbconnection =
util.script_startup('Graph execution time by plan')

# Get user input

sql_id=util.input_with_default('SQL_ID','acrg0q0qtx3gr')

mainquery = sqlstatwithplans(sql_id)

mainresults = dbconnection.run_return_flipped_results(mainquery)

util.exit_no_results(mainresults)

date_times = mainresults[0]
plan_hash_values = mainresults[1]
elapsed_times = mainresults[2]
num_rows = len(date_times)

# build list of distict plan hash values

distinct_plans = []
for phv in plan_hash_values:
    string_phv = str(phv)
    if string_phv not in distinct_plans:
        distinct_plans.append(string_phv)

# build a list of elapsed times by plan

# create list with num plans empty lists

elapsed_by_plan = []
for p in distinct_plans:
    elapsed_by_plan.append([])

# update an entry for every plan
# None for ones that aren't
# in the row

for i in range(num_rows):
    plan_num = distinct_plans.index(str(plan_hash_values[i]))
    for p in range(len(distinct_plans)):
        if p == plan_num:
            elapsed_by_plan[p].append(elapsed_times[i])
        else:
            elapsed_by_plan[p].append(None)

# plot query

myplot.xlabels = date_times
myplot.ylists = elapsed_by_plan

myplot.title = "Sql_id "+sql_id+" on "+database+
" database with plans"
myplot.ylabel1 = "Averaged Elapsed Seconds"

myplot.ylistlabels=distinct_plans

myplot.line()
Having all of the Python code for this one graph in a single file made it much faster to put together a new graph. Pretty neat.
Bobby


Thanks for sharing valuable information
You’re welcome. I am glad that you found it to be helpful.
Bobby