I was testing a script that did a lot of very short SQL statements and running many of them at the same time to bog down the CPU on the database server. I kept seeing high “SQL*Net message from client” waits from my profiling SQL code.
Normally a profile of a single long running statement when there is a large CPU queue looks like this:
SUBSTR(TIMESOURCE,1,30)           SECONDS PERCENTAGE
------------------------------ ---------- ----------
TOTAL_TIME                             74        100
UNACCOUNTED_TIME                       37         50
CPU                                    37         50
This is a one CPU VM with two 100% CPU queries. Each one’s CPU accounts for half of the total elapsed time leaving the other half unaccounted for.
But, take a high CPU load system and run a bunch of short sql statements the profile looks like this:
SUBSTR(TIMESOURCE,1,30)           SECONDS PERCENTAGE
------------------------------ ---------- ----------
TOTAL_TIME                             13        100
SQL*Net message from client             8         62
log file sync                           5         38
CPU                                     1          8
This is a script with a bunch of insert/commit combinations like this:
insert into testtable values (1);
commit;
insert into testtable values (1);
commit;
insert into testtable values (1);
commit;
insert into testtable values (1);
commit;
insert into testtable values (1);
commit;
insert into testtable values (1);
commit;
insert into testtable values (1);
commit;
insert into testtable values (1);
commit;
Without the high CPU load the profile is like this:
SUBSTR(TIMESOURCE,1,30)           SECONDS PERCENTAGE
------------------------------ ---------- ----------
TOTAL_TIME                              3        100
SQL*Net message from client             1         33
CPU                                     1         33
log file sync                           1         33
It looks like the SQL*Net message from client and log file sync times were both inflated by the high CPU load in the previous profile.
I tried this for shared and dedicated servers and for some reason shared servers reports even more SQL*Net waits for the same CPU load:
SUBSTR(TIMESOURCE,1,30)           SECONDS PERCENTAGE
------------------------------ ---------- ----------
TOTAL_TIME                             20        100
SQL*Net message from client            14         70
log file sync                           6         30
CPU                                     1          5
In further testing I was getting twice as many SQL*Net message from client waits for the same script with shared servers compared to dedicated so maybe that is why shared server connections are more sensitive to high CPU loads and report higher SQL*Net message from client waits.
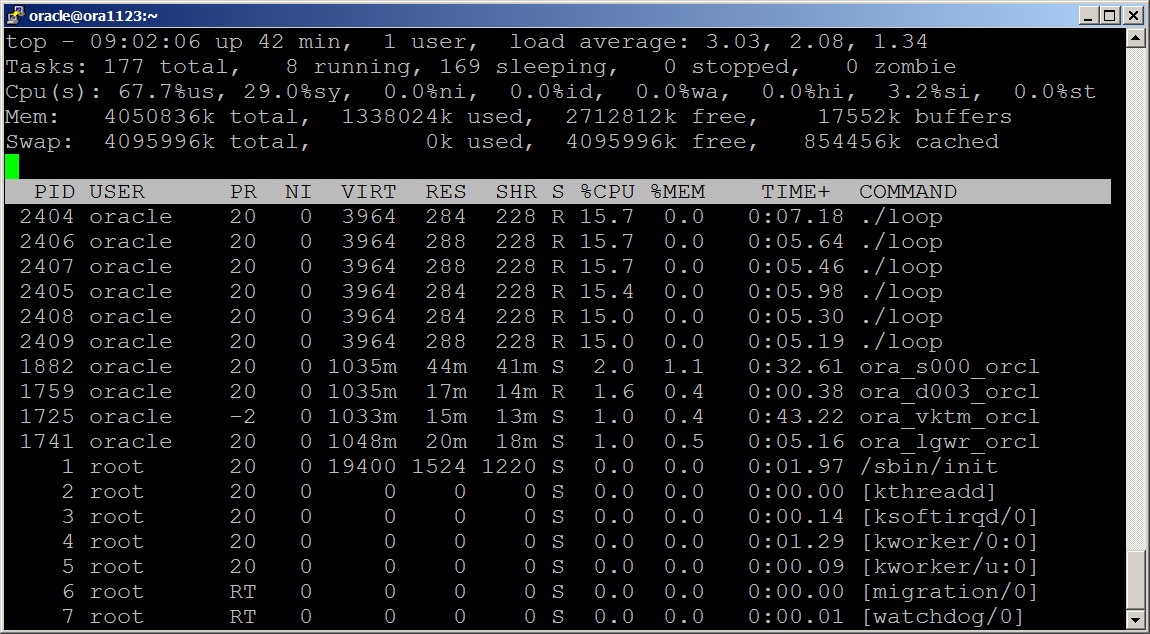
Here is what the CPU looked like for the shared server example:
Notice the six loops – a simple C program with infinite loop. These should be starving the other oracle processes for the CPU. Note that this is the “c” option of top which is really helpful because it shows you the oracle process names like ora_lgwr_orcl similar to the default display on HP-UX’s glance tool.
So, I guess I was surprised that SQL*Net message from client waits were inflated by queuing on the CPU but it looks like they are. This appears to be most visible when you have a lot of short run time SQL statements.
– Bobby


Yes, this is akin to something that Cary Milsap has been pointing out for years, although I’d never heard of it manifesting on SQL*Net waits. Basically, Oracle can’t (or just doesn’t) instrument when its processes are ready to run (so not waiting for an I/O or some other event) but due to contention or OS policy, etc., no CPU Is available.
I’ve heard of it being charged to elapsed CPU, when it’s multitasked off of the CPU and Oracle doesn’t notice. I’ve heard it being charged to db file (sequential|scattered) reads, which are marked “ready to run” by the OS but haven’t gotten on CPU yet so Oracle knows to stop its stopwatch. This is really another manifestation of the same thing, although on a network I/O event instead of disk I/O (using the term “network” loosely if it’s a bequeath connection, I suppose).
I don’t know if modern OSes have enough instrumentation available that Oracle could notice if it wanted to how much elapsed time was actually wasted due to CPU contention–if they do, I wish Oracle would start taking advantage of it.
Jason,
Thank you for your reply. I think you are right about why the time is showing up in the waits. It would be nice to see CPU queue time more clearly but I’m not sure if that’s going to happen any time soon.
– Bobby