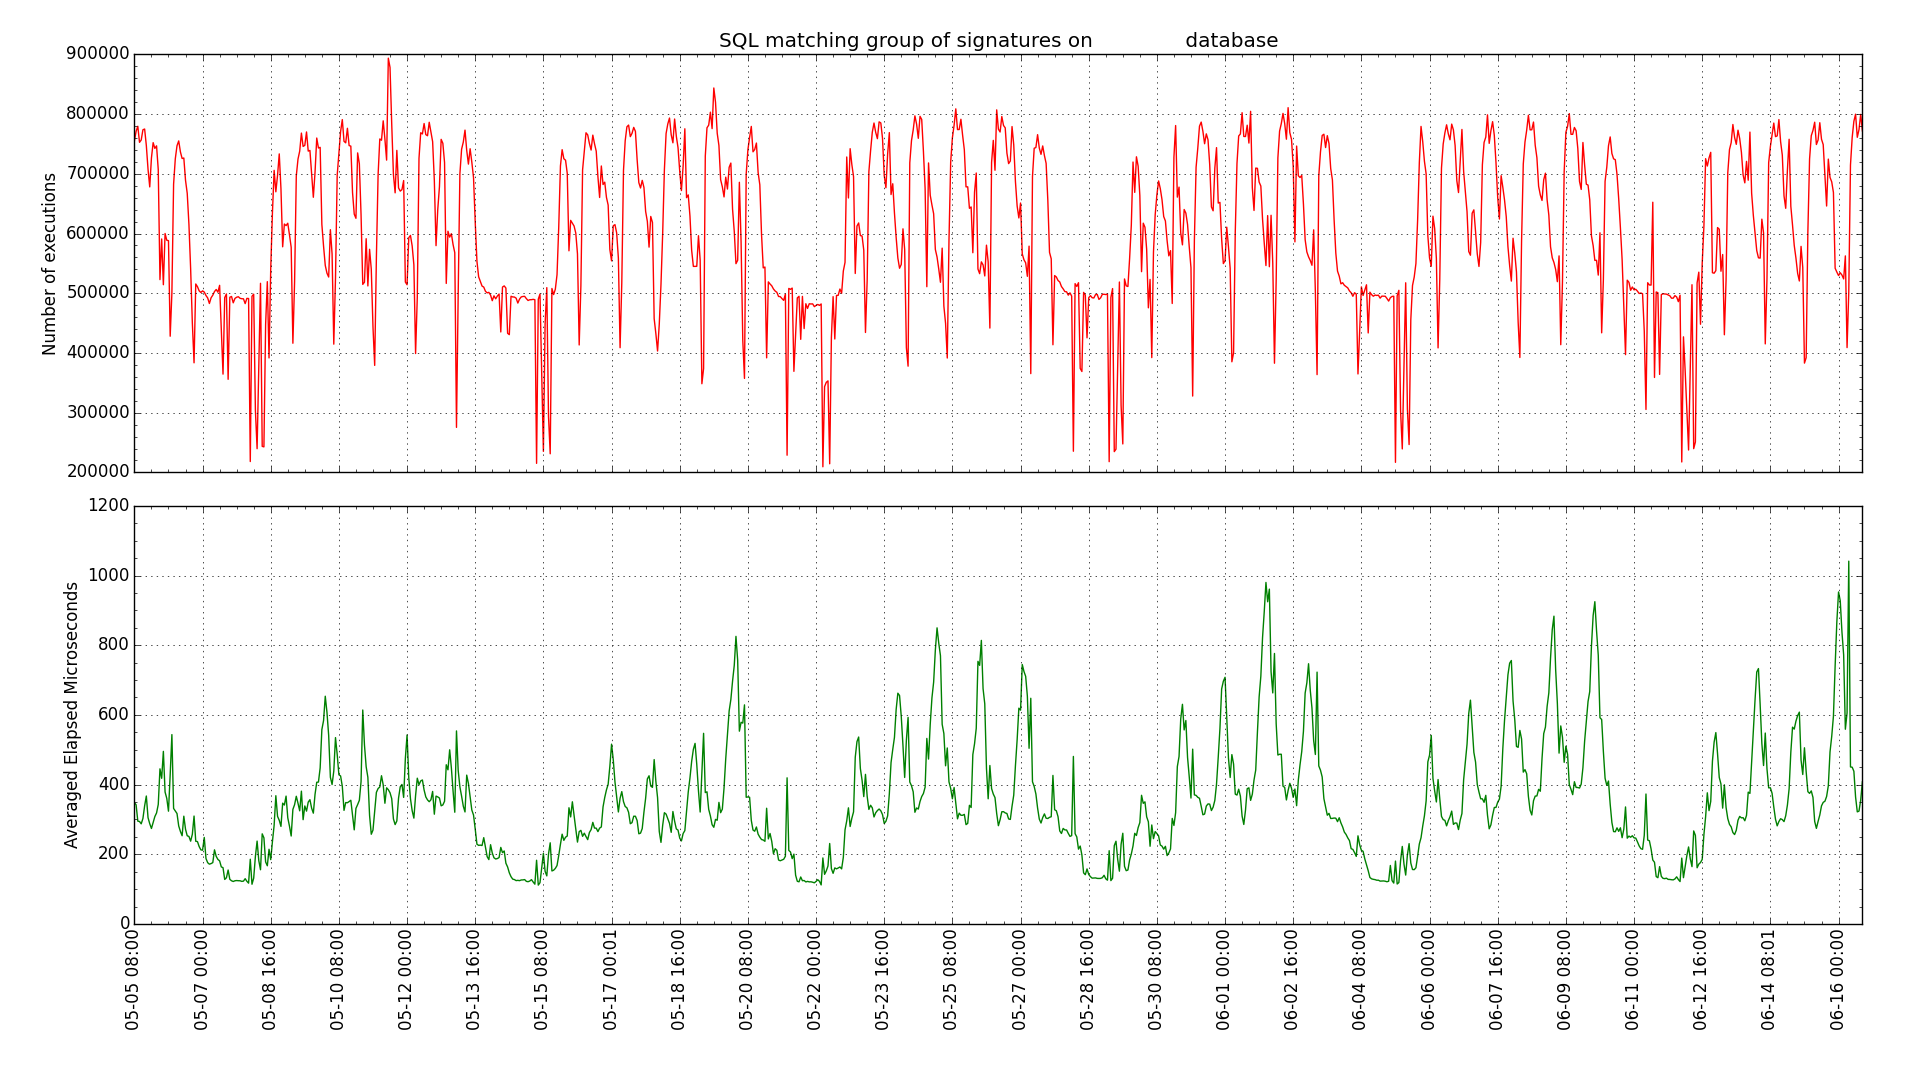
I made a new graph in my PythonDBAGraphs program. Here is an example with real data but the database name blanked out:
My graphs are all sized for 1920 x 1080 monitors so I can see all the detail in the lines using my entire screen. The idea for this graph is to show how the performance of the queries that matter to the users changes as we add more load and data to this production database. I knew that this database had many queries with literals in their where clauses. I decided to pick a group of SQL by FORCE_MATCHING_SIGNATURE and to graph the average elapsed run time against the total number of executions.
I used this query to list all the SQL by signature:
column FORCE_MATCHING_SIGNATURE format 99999999999999999999

select FORCE_MATCHING_SIGNATURE,
sum(ELAPSED_TIME_DELTA)/1000000 total_seconds,
sum(executions_delta) total_executions,
count(distinct sql_id) number_sqlids,
count(distinct snap_id) number_hours,
min(PARSING_SCHEMA_NAME)
from DBA_HIST_SQLSTAT
group by FORCE_MATCHING_SIGNATURE
order by number_hours desc;
This is an edited version of the output – cut down to fit the page:
FORCE_MATCHING_SIGNATURE TOTAL_SECONDS TOTAL_EXECUTIONS NUMBER_HOURS
------------------------ ------------- ---------------- ------------
    14038313233049026256     22621.203         68687024         1019
    18385146879684525921    18020.9776        157888956         1013
     2974462313782736551    22875.4743           673687          993
    12492389898598272683    6203.78985         66412941          992
    14164303807833460050    4390.32324           198997          980
    10252833433610975622    6166.07675           306373          979
    17697983043057986874    17391.0907         25914398          974
    15459941437096211273    9869.31961          7752698          967
     2690518030862682918    15308.8561          5083672          952
     1852474737868084795    50095.5382          3906220          948
     6256114255890028779    380.095915          4543306          947
    16226347765919129545    9199.14289           215756          946
    13558933806438570935    394.913411          4121336          945
    12227994223267192558    369.784714          3970052          945
    18298186003132032869    296.887075          3527130          945
    17898820371160082776    184.125159          3527322          944
    10790121820101128903    2474.15195          4923888          943
     2308739084210563004    265.395538          3839998          941
    13580764457377834041    2807.68503         62923457          934
    12635549236735416450    1023.42959           702076          918
    17930064579773119626    2423.03972         61576984          914
    14879486686694324607     33.253284            17969          899
     9212708781170196788     7292.5267           126641          899
      357347690345658614    6321.51612           182371          899
    15436428048766097389     11986.082           334125          886
     5089204714765300123    6858.98913           190700          851
    11165399311873161545    4864.60469         45897756          837
    12042794039346605265    11223.0792           179064          835
    15927676903549361476    505.624771          3717196          832
     9120348263769454156    12953.0746           230090          828
    10517599934976061598     311.61394          3751259          813
     6987137087681155918    540.565595          3504784          809
    11181311136166944889      5018.309         59540417          808
      187803040686893225    3199.87327         12788206          800
I picked the ones that had executed in 800 or more hours. Our AWR has about 1000 hours of history so 800 hours represents about 80% of the AWR snapshots. I ended up pulling one of these queries out because it was a select for update and sometimes gets hung on row locks and skews the graph. So, the graph above has that one pulled out.
I based the graph above on this query:
select
sn.END_INTERVAL_TIME,
sum(ss.executions_delta) total_executions,
sum(ELAPSED_TIME_DELTA)/((sum(executions_delta)+1))
from DBA_HIST_SQLSTAT ss,DBA_HIST_SNAPSHOT sn
where ss.snap_id=sn.snap_id
and ss.INSTANCE_NUMBER=sn.INSTANCE_NUMBER
and ss.FORCE_MATCHING_SIGNATURE in
(
14038313233049026256,
18385146879684525921,
2974462313782736551,
12492389898598272683,
14164303807833460050,
10252833433610975622,
17697983043057986874,
15459941437096211273,
2690518030862682918,
6256114255890028779,
16226347765919129545,
13558933806438570935,
12227994223267192558,
18298186003132032869,
17898820371160082776,
10790121820101128903,
2308739084210563004,
13580764457377834041,
12635549236735416450,
17930064579773119626,
14879486686694324607,
9212708781170196788,
357347690345658614,
15436428048766097389,
5089204714765300123,
11165399311873161545,
12042794039346605265,
15927676903549361476,
9120348263769454156,
10517599934976061598,
6987137087681155918,
11181311136166944889,
187803040686893225
)
group by sn.END_INTERVAL_TIME
order by sn.END_INTERVAL_TIME;
Only time will tell if this really is a helpful way to check system performance as the load grows, but I thought it was worth sharing what I had done. Some part of this might be helpful to others.
Bobby


