We have had problems with set of databases over the past few weeks. Our team does not support these databases, but my director asked me to help. These are 11.2.0.1 Windows 64 bit Oracle databases running on Windows 2008. The incident reports said that the systems stop working and that the main symptom was that the oracle.exe process uses all the CPU. They were bouncing the database server when they saw this behavior and it took about 30 minutes after the bounce for the CPU to go back down to normal. A Windows server colleague told me that at some point in the past a new version of virus software had apparently caused high CPU from the oracle.exe process.
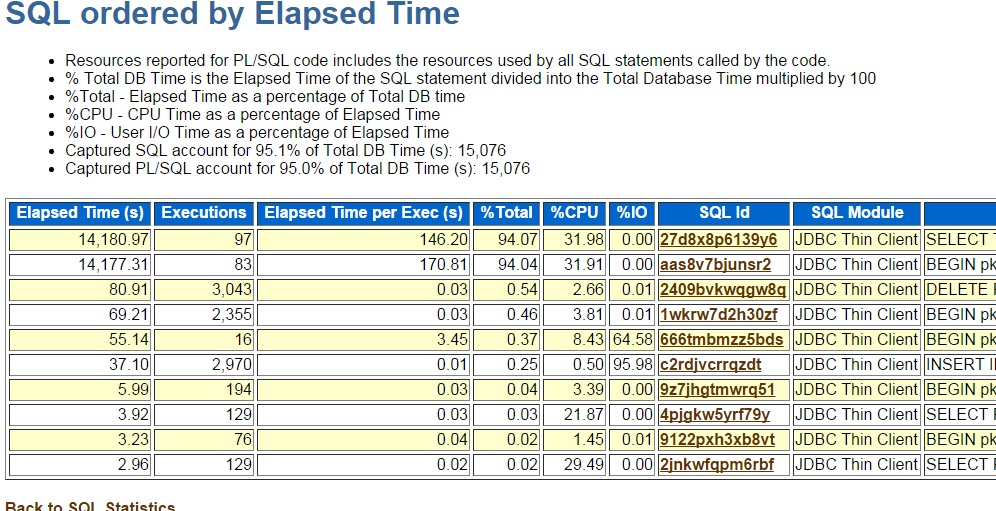
At first I looked for some known bugs related to high CPU and virus checkers without much success. Then I got the idea of just checking for query performance. After all, a poorly performing query can eat up a lot of CPU. These Windows boxes only have 2 cores so it would not take many concurrently running high CPU queries to max it out. So, I got an AWR report covering the last hour of a recent incident. This was the top SQL:
The top query, sql id 27d8x8p6139y6, stood out as very inefficient and all CPU. It seemed clear to me from this listing that the 2 core box had a heavy load and a lot of waiting for CPU queuing. %IO was zero but %CPU was only 31%. Most likely the rest was CPU queue time.
I also looked at my sqlstat report to see which plans 27d8x8p6139y6 had used over time.
PLAN_HASH_VALUE END_INTERVAL_TIME     EXECUTIONS Elapsed ms
--------------- --------------------- ---------- -----------
     3067874494 07-MAR-16 09.00.50 PM        287  948.102286
     3067874494 07-MAR-16 10.00.03 PM        292  1021.68191
     3067874494 07-MAR-16 11.00.18 PM        244  1214.96161
     3067874494 08-MAR-16 12.00.32 AM        276  1306.16222
     3067874494 08-MAR-16 01.00.45 AM        183  1491.31307
      467860697 08-MAR-16 01.00.45 AM        125      .31948
      467860697 08-MAR-16 02.00.59 AM        285  .234073684
      467860697 08-MAR-16 03.00.12 AM        279  .214354839
      467860697 08-MAR-16 04.00.25 AM        246   .17147561
      467860697 08-MAR-16 05.00.39 AM         18        .192
     2868766721 13-MAR-16 06.00.55 PM         89    159259.9
     3067874494 13-MAR-16 06.00.55 PM          8  854.384125
     2868766721 13-MAR-16 07.00.50 PM         70  1331837.56
Plan 2868766721 seemed terrible but plan 467860697 seemed great.
Our group doesn’t support these databases so I am not going to dig into how the application gathers statistics, what indexes it uses, or how the vendor designed the application. But, it seems possible that forcing the good plan with a SQL Profile could resolve this issue without having any access to the application or understanding of its design.
But, before plunging headlong into the use of a SQL Profile I looked at the plan and the SQL text. I have edited these to hide any proprietary details:
SELECT T.*
    FROM TAB_MYTABLE1 T,
         TAB_MYTABLELNG A,
         TAB_MYTABLE1 PIR_T,
         TAB_MYTABLELNG PIR_A
   WHERE     A.MYTABLELNG_ID = T.MYTABLELNG_ID
         AND A.ASSIGNED_TO = :B1
         AND A.ACTIVE_FL = 1
         AND T.COMPLETE_FL = 0
         AND T.SHORTED_FL = 0
         AND PIR_T.MYTABLE1_ID = T.PIR_MYTABLE1_ID
         AND ((PIR_A.FLOATING_PIR_FL = 1
               AND PIR_T.COMPLETE_FL = 1)
              OR PIR_T.QTY_PICKED IS NOT NULL)
         AND PIR_A.MYTABLELNG_ID = PIR_T.MYTABLELNG_ID
         AND PIR_A.ASSIGNED_TO IS NULL
ORDER BY T.MYTABLE1_ID
The key thing I noticed is that there was only one bind variable. The innermost part of the good plan uses an index on the column that the query equates with the bind variable. The rest of the plan is a nice nested loops plan with range and unique index scans. I see plans in this format in OLTP queries where you are looking up small numbers of rows using an index and join to related tables.
-----------------------------------------------------------------
Id | Operation                        | Name
-----------------------------------------------------------------
 0 | SELECT STATEMENT                 |
 1 |  SORT ORDER BY                   |
 2 |   NESTED LOOPS                   |
 3 |    NESTED LOOPS                  |
 4 |     NESTED LOOPS                 |
 5 |      NESTED LOOPS                |
 6 |       TABLE ACCESS BY INDEX ROWID| TAB_MYTABLELNG
 7 |        INDEX RANGE SCAN          | AK_MYTABLELNG_BY_USER
 8 |       TABLE ACCESS BY INDEX ROWID| TAB_MYTABLE1
 9 |        INDEX RANGE SCAN          | AK_MYTABLE1_BY_MYTABLELNG
10 |      TABLE ACCESS BY INDEX ROWID | TAB_MYTABLE1
11 |       INDEX UNIQUE SCAN          | PK_MYTABLE1
12 |     INDEX UNIQUE SCAN            | PK_MYTABLELNG
13 |    TABLE ACCESS BY INDEX ROWID   | TAB_MYTABLELNG
-----------------------------------------------------------------
The bad plan had a gross Cartesian merge join:
Plan hash value: 2868766721

----------------------------------------------------------------
Id | Operation                       | Name
----------------------------------------------------------------
 0 | SELECT STATEMENT                |
 1 |  NESTED LOOPS                   |
 2 |   NESTED LOOPS                  |
 3 |    MERGE JOIN CARTESIAN         |
 4 |     TABLE ACCESS BY INDEX ROWID | TAB_MYTABLE1
 5 |      INDEX FULL SCAN            | PK_MYTABLE1
 6 |     BUFFER SORT                 |
 7 |      TABLE ACCESS BY INDEX ROWID| TAB_MYTABLELNG
 8 |       INDEX RANGE SCAN          | AK_MYTABLELNG_BY_USER
 9 |    TABLE ACCESS BY INDEX ROWID  | TAB_MYTABLE1
10 |     INDEX RANGE SCAN            | AK_MYTABLE1_BY_MYTABLELNG
11 |   TABLE ACCESS BY INDEX ROWID   | TAB_MYTABLELNG
12 |    INDEX RANGE SCAN             | AK_MYTABLELNG_BY_USER
----------------------------------------------------------------
Reviewing the SQL made me believe that there was a good chance that a SQL Profile forcing the good plan would resolve the issue. Sure, there could be some weird combination of data and bind variable values that make the bad plan the better one. But, given that this was a simple transactional application it seems most likely that the straightforward nested loops with index on the only bind variable plan would be best.
We used the SQL Profile to force these plans on four servers and so far the SQL Profile has resolved the issues. I’m not saying that forcing a plan using a SQL Profile is the only or even best way to resolve query performance issues. But, this was a good example of where a SQL Profile makes sense. If modifying the application, statistics, parameters, and schema is not possible then a SQL Profile can come to your rescue in a heartbeat.
Bobby


