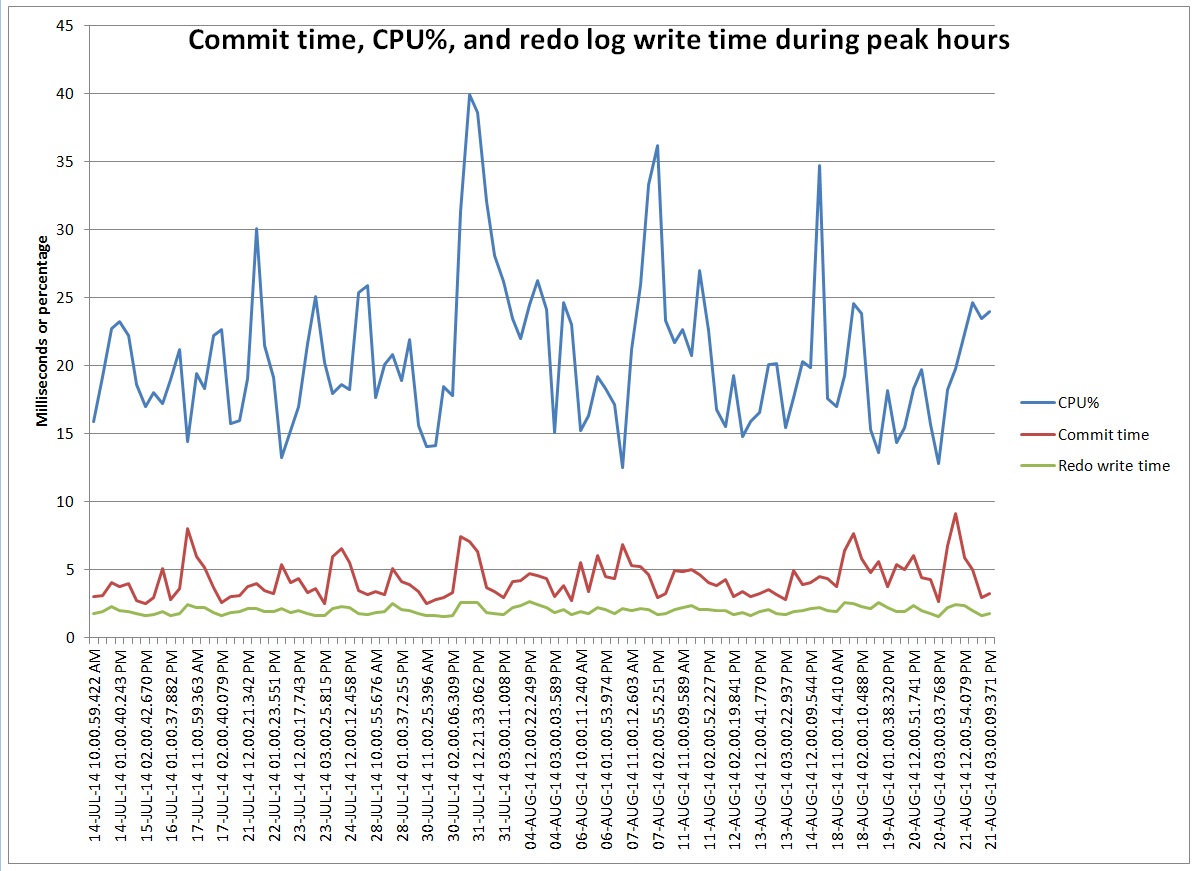
This graph represents commit time compared to CPU utilization and redo log write time. I’ve included only the hourly intervals with more than 1,000,000 commits. At these peaks the number of commits ranges 1 to 1.6 million commits per hour so each point on the graph represents roughly the same commit rate. I’m puzzled by why the commit time bounces around peaking above 5 milliseconds when I can’t see any peaks in I/O or CPU that correspond to the commit time peaks.
I derived CPU% from DBA_HIST_OSSTAT. I got the other values by getting wait events from DBA_HIST_SYSTEM_EVENT. Commit time is log file sync wait time. Redo write time is log file parallel write wait time. I converted the wait times to milliseconds so they fit nicely on the chart with CPU%.
I thought I would pass this along as a puzzle that I haven’t figured out.
Here is a zip of the script I used to get the data, its raw output, and the spreadsheet I used to make the chart: zip
– Bobby
P.S. This is on HP-UX 11.31, Itanium, Oracle 11.2.0.3
P.P.S Did some more work on this today. Looks like the high commit time periods have short spikes of long redo log writes even though the average over the hour is still low. I’m looking at DBA_HIST_SYSTEM_EVENT to get a histogram of the log file parallel write waits and there are a number in the 1024 bucket when the log file sync time is high on average.
END_INTERVAL_TIME   LFPW_MILLI LFPW_COUNT AVG_COMMIT_MS AVG_WRITE_MS
------------------- ---------- ---------- ------------- ------------
21-AUG-14 11.00 AM           1     268136    9.14914833   2.45438987
21-AUG-14 11.00 AM           2     453913    9.14914833   2.45438987
21-AUG-14 11.00 AM           4     168370    9.14914833   2.45438987
21-AUG-14 11.00 AM           8      24436    9.14914833   2.45438987
21-AUG-14 11.00 AM          16       5675    9.14914833   2.45438987
21-AUG-14 11.00 AM          32       6122    9.14914833   2.45438987
21-AUG-14 11.00 AM          64       3369    9.14914833   2.45438987
21-AUG-14 11.00 AM         128       2198    9.14914833   2.45438987
21-AUG-14 11.00 AM         256       1009    9.14914833   2.45438987
21-AUG-14 11.00 AM         512        236    9.14914833   2.45438987
21-AUG-14 11.00 AM        1024         19    9.14914833   2.45438987
21-AUG-14 11.00 AM        2048          0    9.14914833   2.45438987
21-AUG-14 02.00 PM           1     522165    2.97787777   1.64840599
21-AUG-14 02.00 PM           2     462917    2.97787777   1.64840599
21-AUG-14 02.00 PM           4     142612    2.97787777   1.64840599
21-AUG-14 02.00 PM           8      17014    2.97787777   1.64840599
21-AUG-14 02.00 PM          16       4656    2.97787777   1.64840599
21-AUG-14 02.00 PM          32       5241    2.97787777   1.64840599
21-AUG-14 02.00 PM          64       1882    2.97787777   1.64840599
21-AUG-14 02.00 PM         128        820    2.97787777   1.64840599
21-AUG-14 02.00 PM         256        149    2.97787777   1.64840599
21-AUG-14 02.00 PM         512         10    2.97787777   1.64840599
21-AUG-14 02.00 PM        1024          2    2.97787777   1.64840599
21-AUG-14 02.00 PM        2048          0    2.97787777   1.64840599
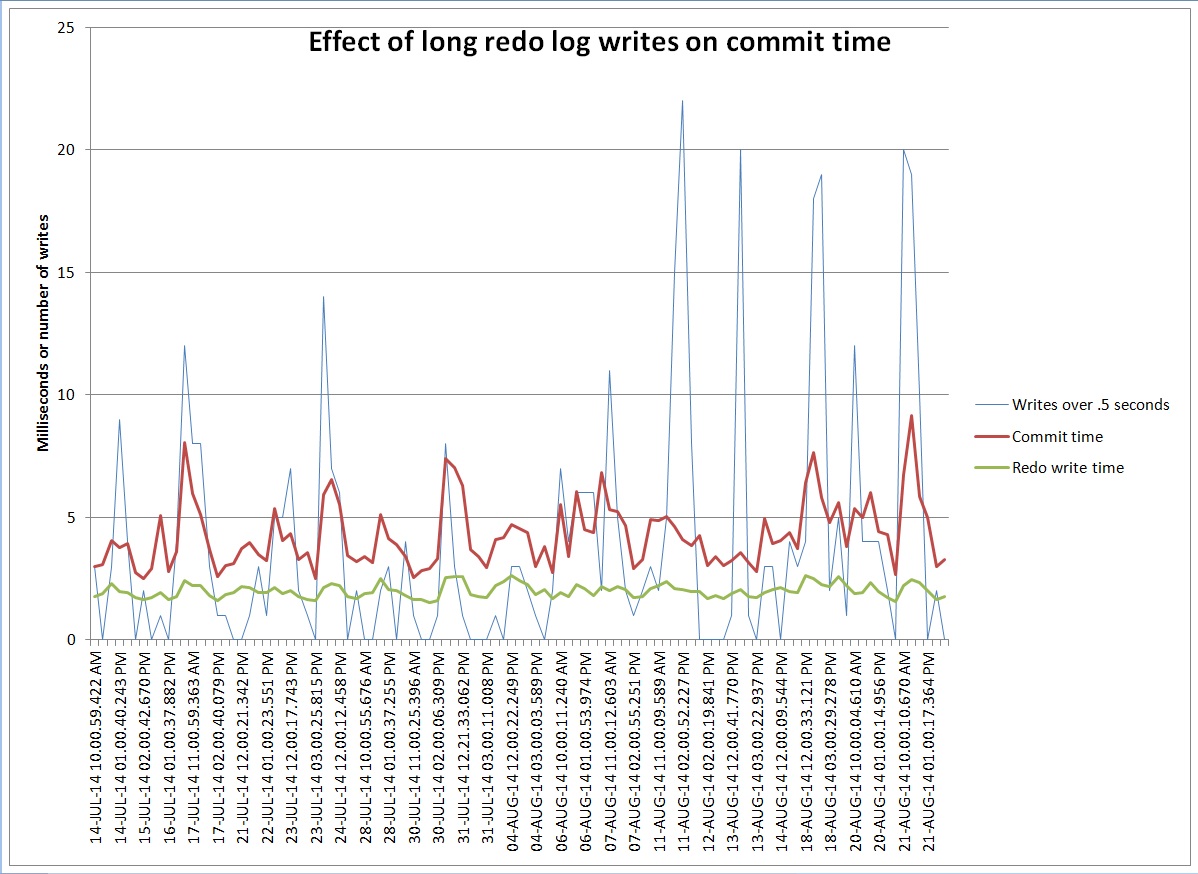
There were 19 waits over half a second in the first hour and only 2 in the second hour. Maybe all the log file sync waits pile up waiting for those long writes. Here is a graph that compares the number of waits over half a second – the 1024 ms bucket – to the average log file sync and log file parallel write times for the hour:
You can see that the average redo write time goes up a little but the commit time goes up more. Maybe commit time is more affected by a few long spikes than by a lot of slightly longer write times.
Found a cool blog post that seems to explain exactly what we are seeing: blog post(DOES NOT EXIST)


Could it be the various processes posting back and forth to each other have random queue times to be on cpu? cpu shared, so percentage of each process running lost in aggregation.
Consider an intersection with stoplights, a mailbox on one corner, post office on another, and various people mailing letters and a postman emptying the mailbox. And nobody jaywalking. The postman will vary in how long to get from the post office to the mailbox and back, while someone is always crossing the street.
It’s Friday afternoon and my brain is too tired to comprehend your intersection example. Maybe I’ll wait until Monday and it will be clearer. 🙂 Thank you for your comment and have a great weekend.
Bobby,
1.6M commits per hour is roughly 445 per second, and at that sort of volume the statistical stampling from ASH could be quite interesting – for the recent past a query that sums the number of active sessions per session waiting on log file sync might show an extreme variation in the number of session waiting, and hours with very large spikes might correspond to the hours with the very long waits.
Another point about large numbers waiting on LFS (made, I think, by Kevin Closson a couple of years ago) is that when LGWR allows the waiting sessions to resume you get a storm of processes coming back into the run queue, pushing LGWR to the bottom of the queue so that LGWR has to wait a “long” time before it can start its next write. At that point, any sessions already in LFS are going to wait even longer because LGWR can’t write. (Does LGWR have a raised priority in your system – how many CPUs do you have ?)
As James’ article points out, a single very slow write can scale up by (half) the number of sessions in the LFS – but in the right circumstances the side effect of the write cause a large queue of waiters might result in a catastrophe for LGWR that takes a few seconds to flatten out.
Jonathan,
Thank you for your comment. Our system has 12 CPUs and 36 shared servers. We did not change the log writer process from its default priority. We implemented shared servers to prevent the log writer from being starved from the CPU by dedicated server processes during login storms from our farm of web servers. We occasionally see login storms from the web servers and these sometimes correspond to higher log file sync waits. During these times in ASH I see all 36 shared server processes waiting on log file sync and the log writer process waiting on log file parallel write. I’m wondering if something is causing the writes to the redo logs to take a long time and that is increasing the commit time and causing a login storm. The web application commits every update which is why we have such frequent commits, and we don’t want to risk losing updates by moving to nowait commits.
At this point I’m convinced that we are seeing long redo log write times, but I’m not sure how to figure out the source of the problem or recommend a solution. We are not using direct I/O on this system but I’m not sure that direct I/O has any relationship to long write times. One thought was to move the redo logs to some sort of flash memory that was attached directly to the database server rather than attached to the storage system that we access over the SAN. But, I’ve seen some cautions on Oracle’s support site about using flash for redo logs. It may be that those cautions are out of date and that modern flash memory can deliver consistent write times that our SAN can not. Thanks again for your input.
– Bobby
Bobby,
This is the sort of case where it’s hard to decide what is cause and what is effect.
A couple of thoughts for monitoring: The lgwr trace file reports the time, duration, and size of slow writes (500ms being “slow” though, technically, you could adjust this though hidden parameter _long_log_write_warning_threshold). Are the slow writes large writes, or are they small writes that take extra time no obvious reasons ? (e.g. does the system jam for a few seconds as the AWR dump to disc takes place ?)
Another thing that you could snapshot over very short time periods – v$reqdist (turnaround time on shared server messages and use of queues), v$shared_server (to see how many shared servers are commonly used, and if the usage goes up before, or as a response to, slow lgwr writes).
One thought that I’d want to pursue is that since you’ve got 36 shared servers and 12 CPUs it’s still possible to get a logon storm that shuts out lgwr briefly – especially since a logon requires a relatively large amount of memory to be allocated in the SGA: if you got just 36 simultaneous logon requests you could run into a condition (though it might require you to hit some unknown mutex bug) where most of the sessions spend a lot of time spinning for mutexes, making it hard for lgwr to get onto the CPU. (Remember, a session holds a mutex, while a process holds a latch – perhaps you can get into a situation in shared server systems where the session that’s holding a mutex can’t run for a long time because it’s in the shared server queue, and the sessions ahead of it in the queue are spinning to get that mutex.)
I need to think about your reply more, but here is the tail of the log writer trace file:
*** 2014-08-24 14:54:30.725
Warning: log write elapsed time 536ms, size 27KB
*** 2014-08-24 22:30:59.222
Warning: log write elapsed time 632ms, size 48KB
*** 2014-08-24 22:34:59.428
Warning: log write elapsed time 509ms, size 638KB
*** 2014-08-25 04:53:19.627
Warning: log write elapsed time 627ms, size 184KB
*** 2014-08-25 05:13:03.420
Warning: log write elapsed time 561ms, size 2KB
*** 2014-08-25 05:16:24.642
Warning: log write elapsed time 1114ms, size 2KB
*** 2014-08-25 07:35:49.654
Warning: log write elapsed time 524ms, size 1KB