I’m trying to understand how to prevent the database server that supports one of our web sites from becoming overwhelmed when the CPU %used gets too high. Once CPU gets above about 80% performance takes a nose dive and CPU quickly flat lines at 100% and queuing begins making the system unusable. I mentioned in an earlier post that Tom Kyte, a noted Oracle performance expert, had recommended that our web server run with fewer database sessions. Right now we have hundreds of connections to the database from the web servers. Based on Tom’s recommendation the best number of connections from the web servers to the database would be about twice the number of CPU’s.
I believe that one reason we need to move to fewer sessions is to speed up commit time. When the CPU gets busy the log writer process (LGWR) gets starved for CPU and sessions doing commits back up waiting for their log file sync’s to complete. So, I put together a test using my laptop which compares doing a bunch of inserts and commits spread across two different numbers of sessions. In the first case I used twice the number of CPU’s which corresponds to Tom Kyte’s recommendation. In the second case I used 16 times the number of CPU’s which represents our current configuration with many more sessions than CPU’s on our real web application. My laptop has 2 CPU’s so the first example used 4 sessions and the second test used 32.
The result was that I was able to do 4 sessions with 80,000 inserts and commits each in 143 seconds, but it took me 627 seconds to do 32 sessions with 10,000 inserts and commits each. The main factor in the increase was the increased log file sync time. We know that our web servers do a lot of inserts and commits and that log file sync waits go crazy during our outages so this simple test seems to be a valid comparison.
Here is a profile of the time spent by one of our four sessions:
TIMESOURCE                        SECONDS PERCENTAGE
------------------------------ ---------- ----------
TOTAL_TIME                            143        100
log file sync                          72         50
SQL*Net message from client            44         31
CPU                                    21         15
UNACCOUNTED_TIME                        4          3
Here is the profile of one of the 32 sessions:
TIMESOURCE                        SECONDS PERCENTAGE
------------------------------ ---------- ----------
TOTAL_TIME                            613        100
log file sync                         420         69
SQL*Net message from client           167         27
UNACCOUNTED_TIME                       22          4
CPU                                     3          0
In both cases the row count at the end is 320,000. The AWR reports make it clearer what is going on. The log file sync time in the second case is mostly CPU and much longer than in the first. Here are the top five events with four sessions:
| Event | Waits | Time(s) | Avg wait (ms) | % DB time | Wait Class |
|---|---|---|---|---|---|
| log file sync | 320,008 | 289 | 1 | 73.13 | Commit |
| DB CPU | 109 | 27.56 | |||
| SQL*Net message to client | 640,097 | 2 | 0 | 0.43 | Network |
| log file switch completion | 12 | 1 | 70 | 0.21 | Configuration |
| Disk file operations I/O | 25 | 0 | 17 | 0.11 | User I/O |
Here they are with 32 sessions:
| Event | Waits | Time(s) | Avg wait (ms) | % DB time | Wait Class |
|---|---|---|---|---|---|
| log file sync | 320,094 | 13,535 | 42 | 93.66 | Commit |
| DB CPU | 123 | 0.85 | |||
| Disk file operations I/O | 134 | 10 | 75 | 0.07 | User I/O |
| enq: TX – contention | 252 | 10 | 38 | 0.07 | Other |
| enq: FB – contention | 113 | 5 | 42 | 0.03 | Other |
Note how the log file sync has gone up to 42 milliseconds instead of 1 millisecond. Oracle document “Troubleshooting: log file sync’ Waits [ID 1376916.1]” explains that the background wait “log file parallel write” shows how long the I/O is taking for each log file sync. In the second case log file parallel write was 11 milliseconds so the difference between the log file sync and log file parallel write 42-11=31 ms is mostly CPU queue time.
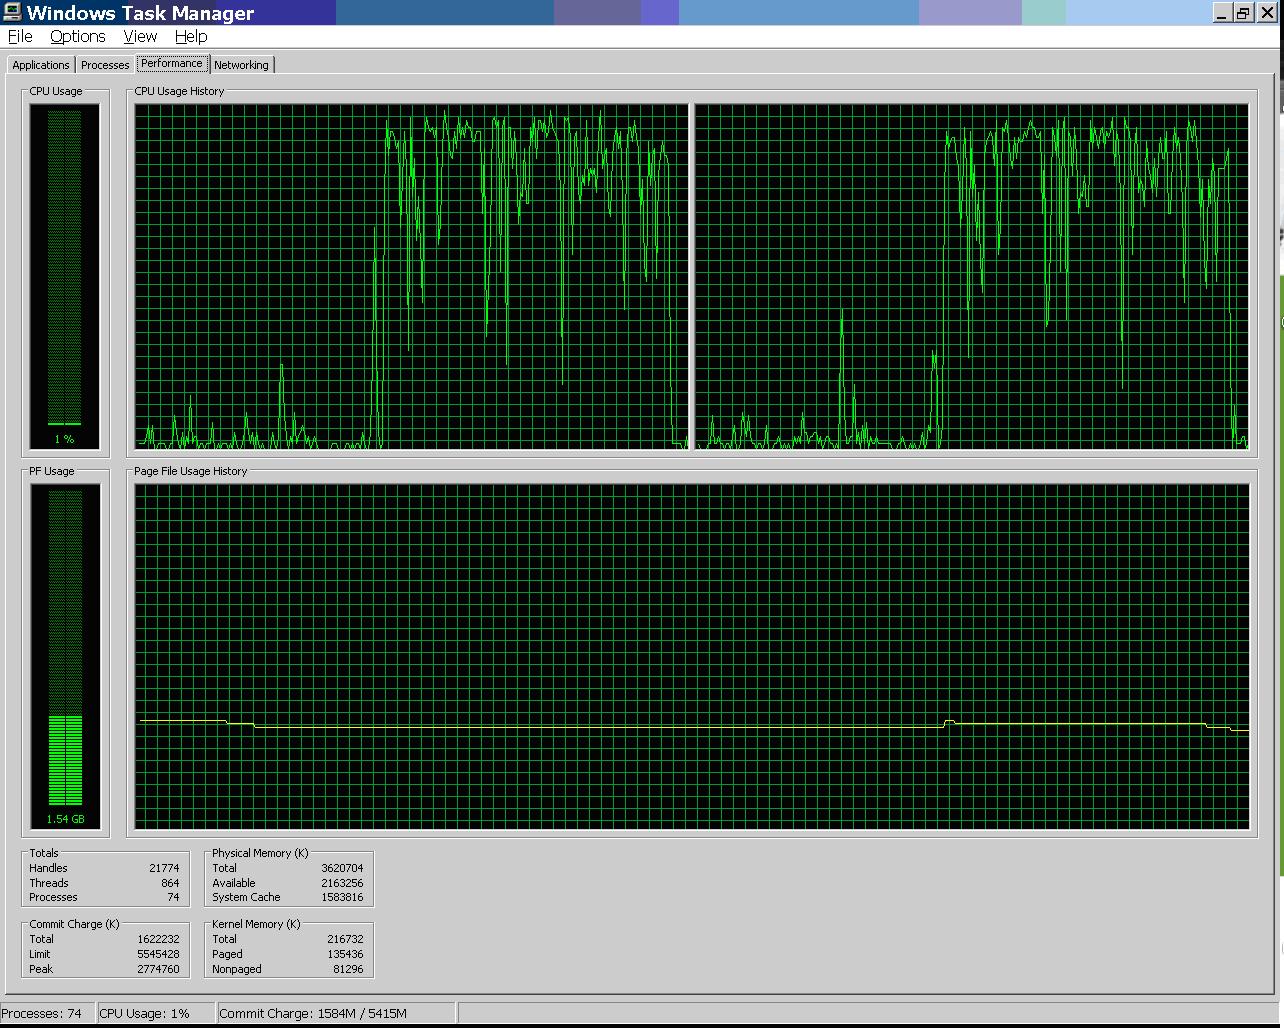
Here is how my CPU looked with four sessions:
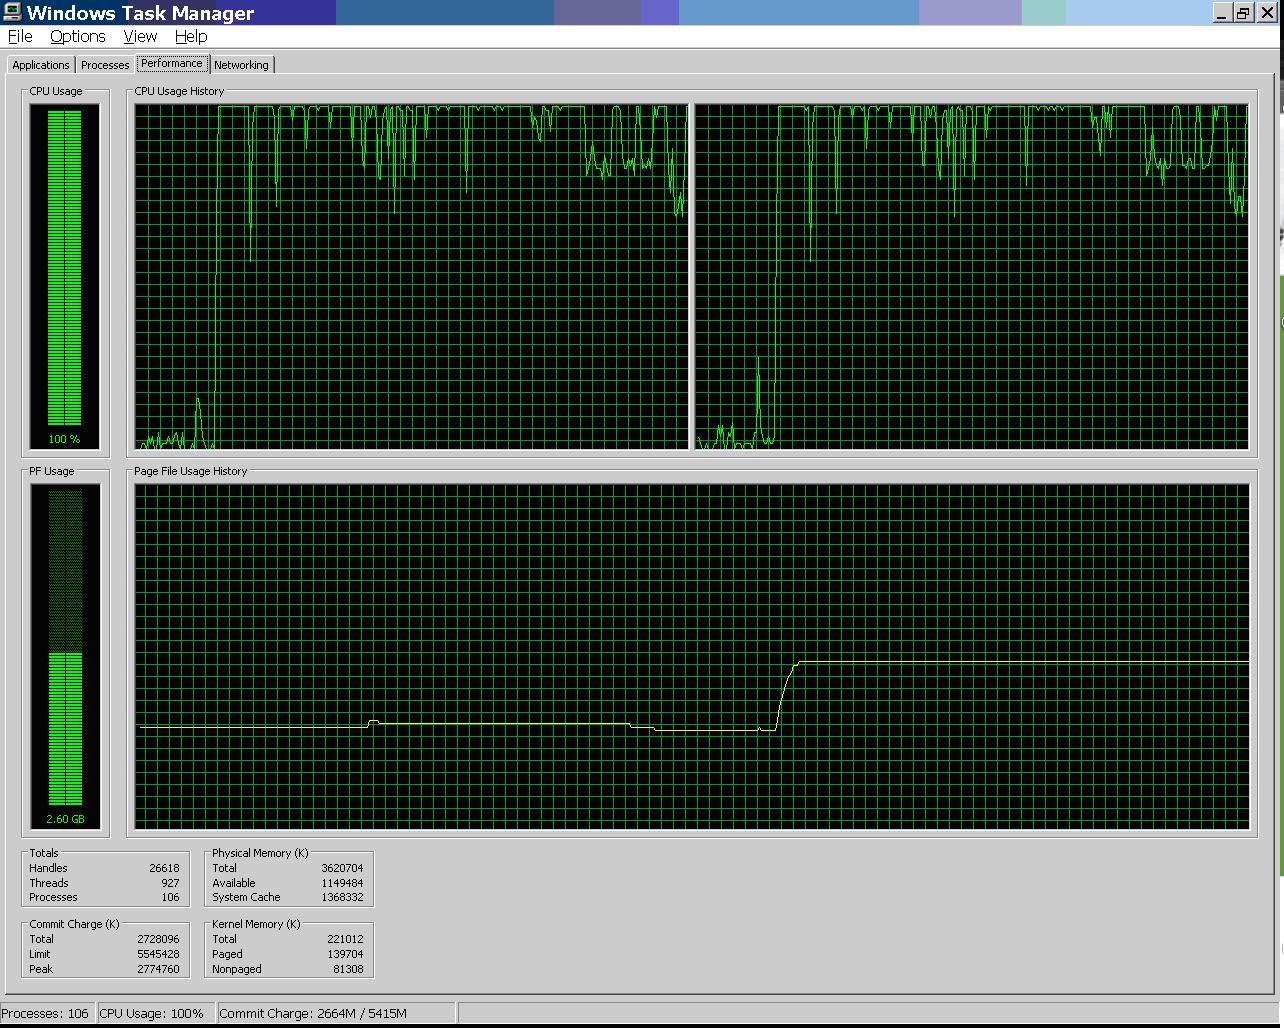
Here is how my CPU looked with 32 sessions:
Here is a zip with all my test files and their output: zip
So, this experiment is evidence to support the idea that if you have a bunch of inserts and commits the total time taken will be less if the number of sessions used is about twice the number of CPU’s as opposed to much more than twice the number of CPUs.
– Bobby


Bobby, that is what connection pooling is for. Also, if there is no possibility of connection pooling, there is always the shared server configuration. It’s a very underutilized feature which can help in certain situations. Having a busy web server with web-to-database connection ratio 1:1 is just not realistic.
Mladen,
I agree with you. In my situation we have an important, heavily used, web site with a farm of web servers using Websphere connection pooling. But, the connection pool averages over 400 database connections. When the CPU spikes on our database server for any reason then the web servers spin up hundreds more connections, the CPU goes through the roof, and the log file sync time goes very high. The web server transactions are short and so we have a lot of commits. So, the example I posted about, which is just on my laptop, simulates what happens when the CPU gets busy and gives me some hope that we can make the web site more resilient if we can reduce the number of connections. I’ve been looking at shared servers because it is something I can do on the database side, but so far my tests have not had good results. But, I’ve never used shared servers before and there may be some simple thing I’m doing wrong or it could just be some limitation of using my laptop to test it.
The challenge is that the application seems to hold on to the connections for a long time so the connection pool isn’t really helping. It isn’t much better than just connecting to the database whenever you want and then disconnecting when you are done.
– Bobby
Pingback: Faster commit time with shared servers | Bobby Durrett's DBA Blog